Digging roulettes
Armed with an equation that sorts patterns in similarity sets I attempt here to find more of the interesting 2nd order roulette patterns. In the last section I attempt another survey of different curves. TLDR: just look at the dizzying patterns in images.
1 Rose and ropy patterns
So far I have been digging for interesting curves in part of the parameter space F=(T1/T,T3/T). Most curves that I have displayed so faw were for about T3 < 2T1. I have tried to tackle the rest of the space, for T3 > 2T1, but I didn’t have much progress. The next figure shows 3 typical outcomes in this part of the parameter space (click for larger image):
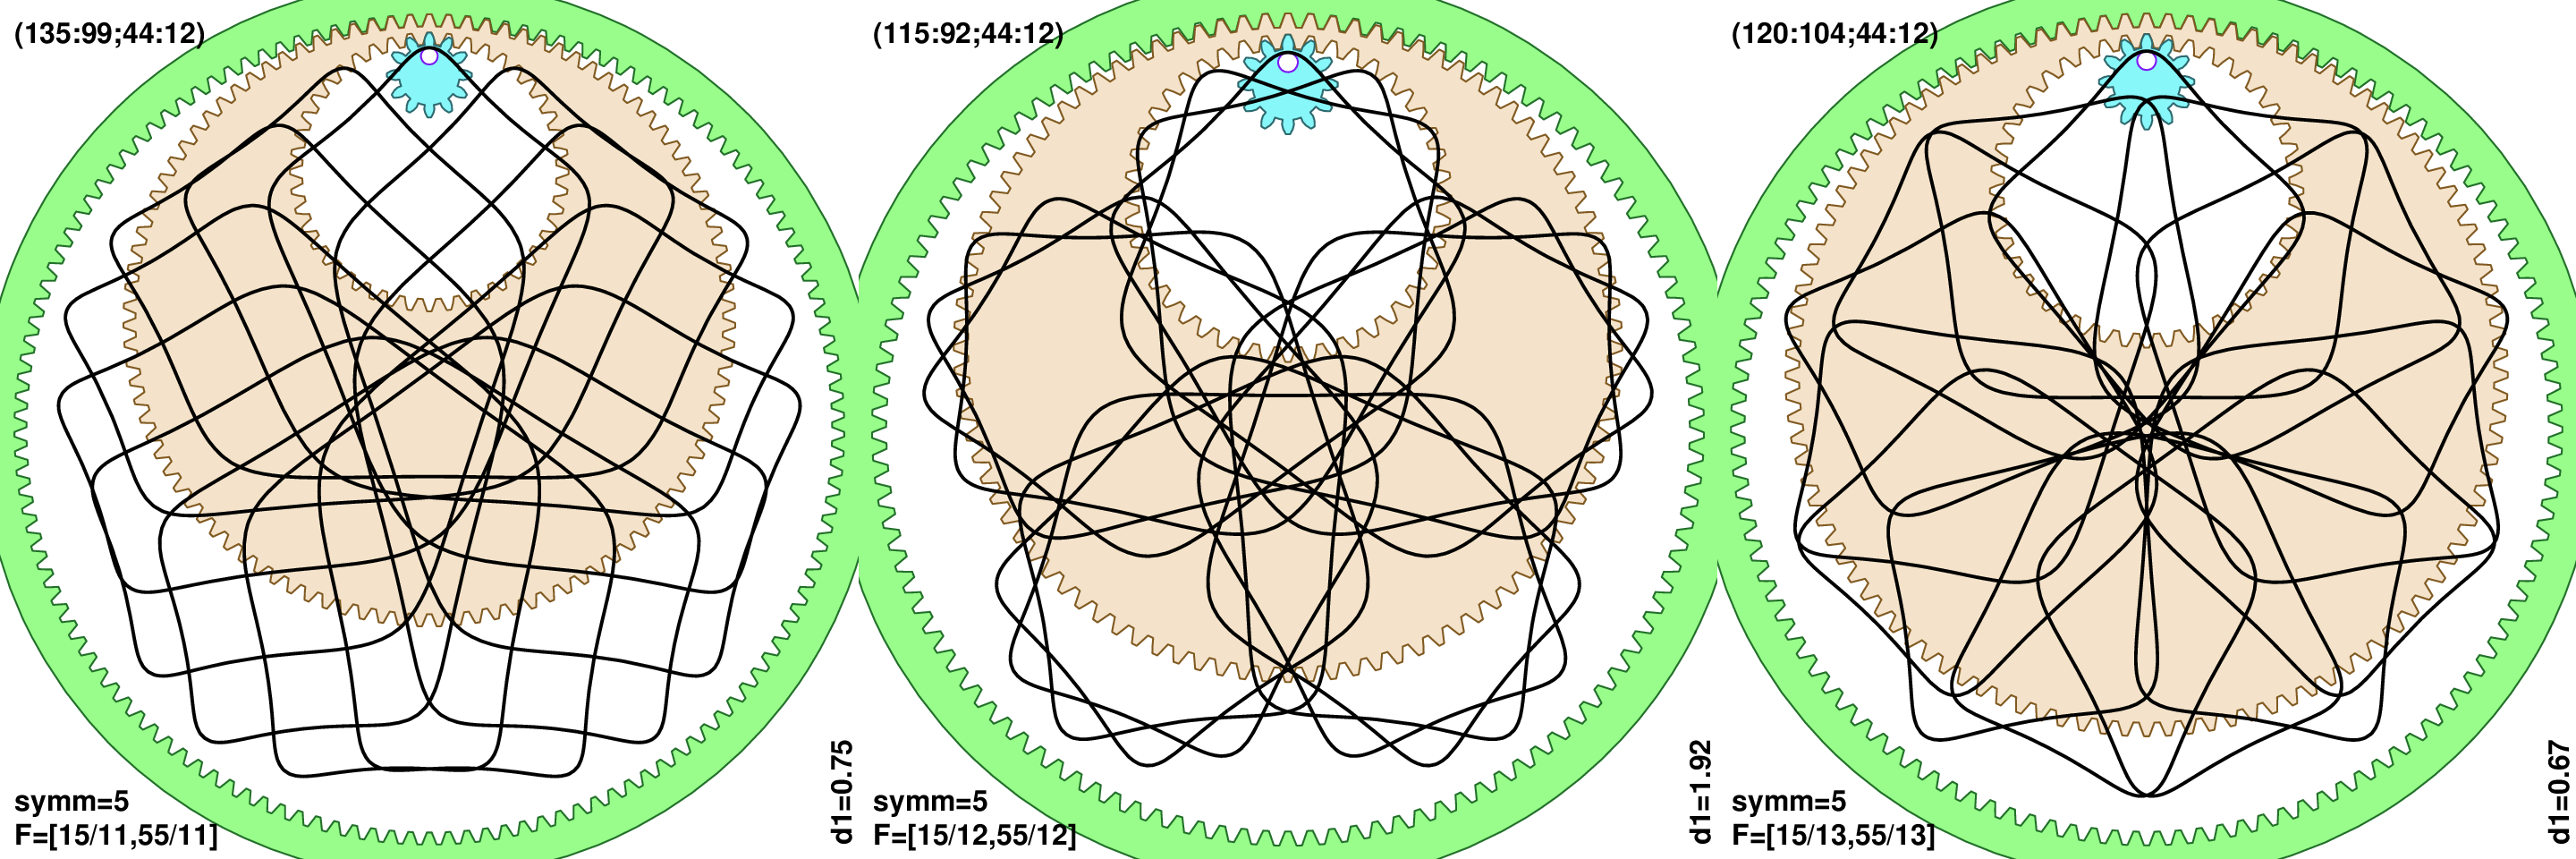
The middle is the famous “ropy” pattern, and left and right are “roses” or some “flowers”. All 3 curves have the same T1=15, and T3=55, while T=11, 12, and 13. That is truly typical outcome for T3 > 2T1. Most curves will look like one of the 3 on display, or some combination of them. To me they are somewhat less interesting. I think that reason for that is that the smallest gear n3 is much smaller than the wheel n0, and there is less mixing of lines from different turns of cogs. And ratio n0/n3 is roughly proportional to T3/T1.
While I didn’t find any way to algorithmically sort different “flowers”, I found an expression that can distinguish “ropy” outcome from “flowers”:
d1 = (n0/n3) ⋅ gcd(T1,T) / T1.
The “ropy” appears when the base hypotrochoid f0 (see here) has fewer lobes. Or in other words when T1 and T are bit commensurable. The expression d1 then compares the distance between lobes of the base hypotrochoid f0 (roughly circumference divided by number of f0 lobes) to the extent of hypotrochoid f1 lines (roughly n3). The larger values of d1 increase the chance that we have a “ropy” curve. A cutoff value seems to be about 1, but it is not sharp cut, more of a gradual transformation. The above image has values: d1=0.75, 1.92 and 0.67.
2 Sorting function
One of the common tasks is to search through big number of combinations to find interesting patterns. I think this is true also when one has bunch of acrylic cogs and is trying to select for next pattern to draw on paper. The best distance function I found to sort patterns from simple to more complex is:
d22 = w1 T12 + w3 (T3 - T1)2 + (T1 - T1/nsymm - T)2
Here w1 and w3 are simple numerical weights, for instance w1=4 and w3=1. The idea is to give more weight to T1, which is the most important parameter. The term with T in the equation is inspired from the similarity sets, as c=0 seems like a central value. The distance function d2 can be combined together with another criterion such as n0/n3<15 or d1<1.5. Or we can say T1<100, meaning “I do not want to roll hoop piece more than 100 times”.
3 A survey of patterns
This is another attempt at survey of patterns, but this time I aim to display curves from different “similarity sets”. The previous article described a striking similarity of curves. For a given constant c=cp/cq, where cp and cq are mutually prime integers, there are infinitely many similar curves F=(T1/T,T3/T) and somewhat recasted equation reads:
T1 = k ⋅ nsymm,
T3 = T1 + l ⋅ cq ⋅ nsymm,
T = T1 - k + l ⋅ cp,
where k and l are now arbitrary positive integers (but not all possible k,l are allowed, the space is like a swiss cheese). Rotational symmetry is nsymm=gcd(T1,T3). Similarity of curves roughly holds for T3 ≤ 2T1, or until we approach “roses” and “ropy” patterns. The condition is roughly equivalent to c≥0.
If we need to recover constant c from a given F=(T1/T,T3/T) we can use the inversion function:
c = ( T1 - nsymm⋅(T1 - T) ) / (T3 - T1).
For each constant c=cp/cq we have an infinite set of similar curves F=(T1/T,T3/T) for k and l integers. Then we can select one curve as a representative (for instance using d2 distance function).
The result is a dizzying array of patterns. Here is a plot for nsymm=7 (click for large image):
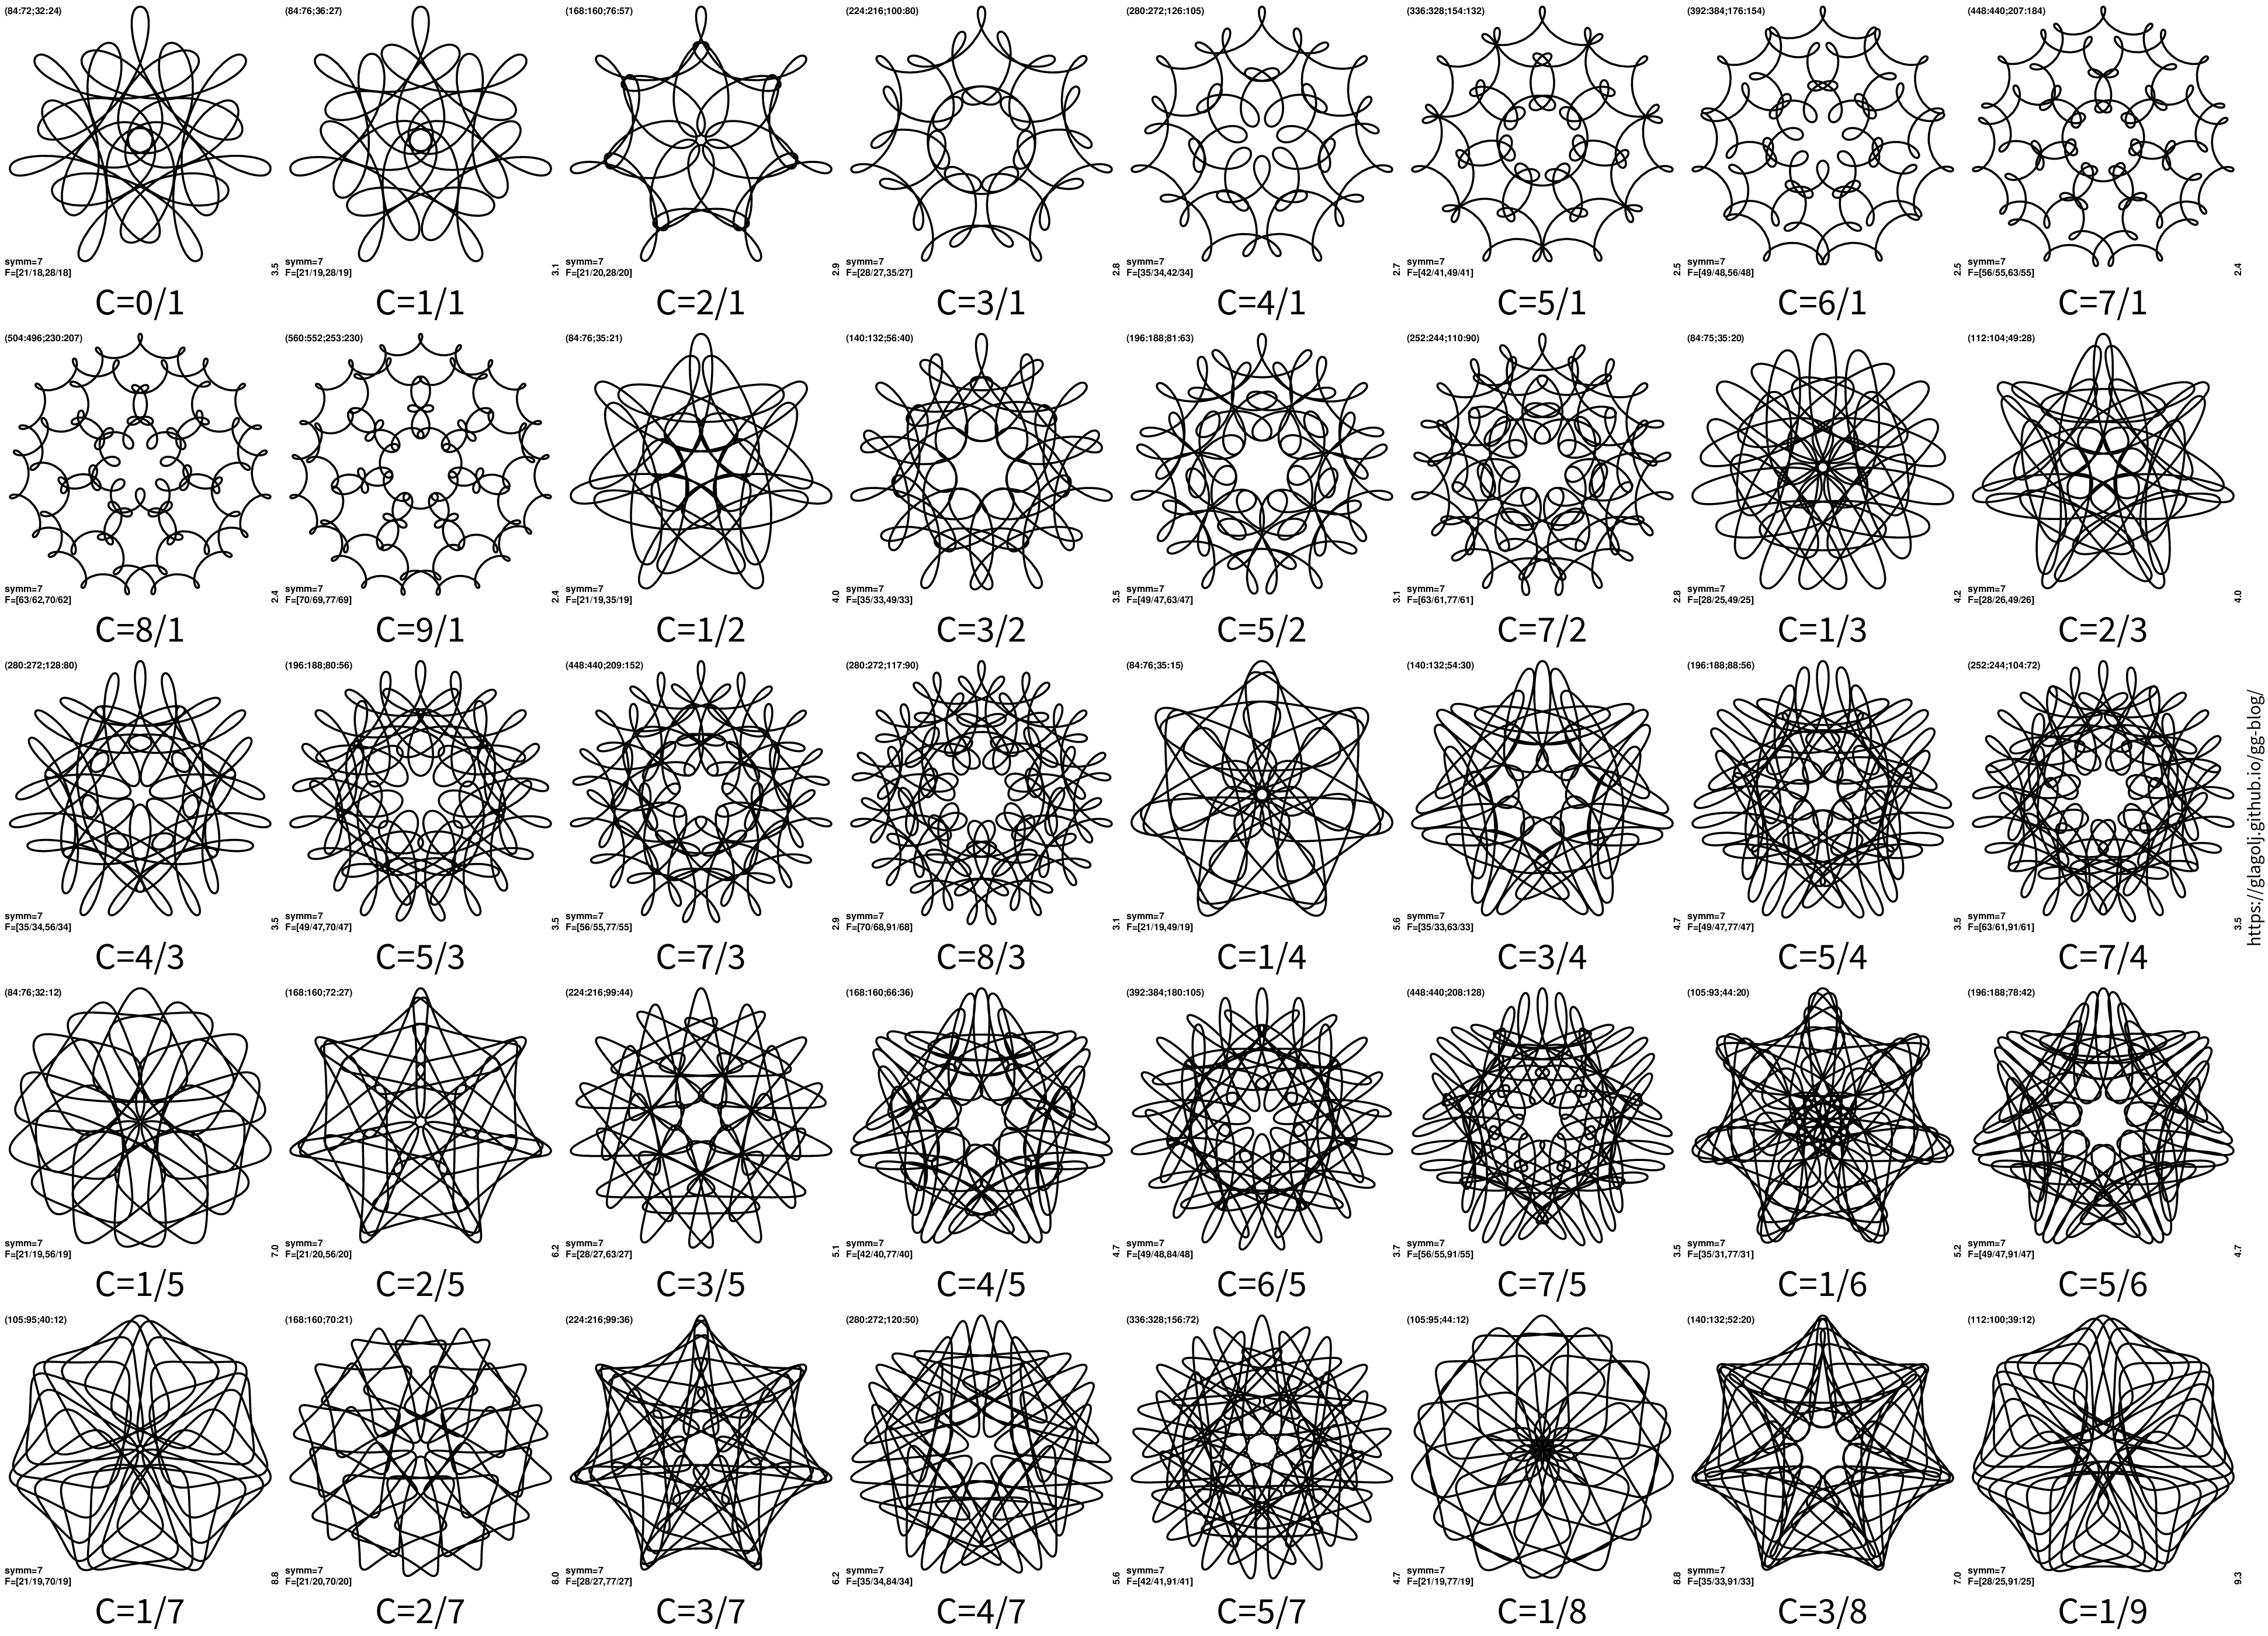
The result looks more even compared to my previous attempt at survey. Part of it is because I was now able to choose more similar “complexity” of curves by picking similar d2 values. And curves are also more varied in shape, as we are now showing patterns “orthogonal” to similarity sets.
Here is plot for nsymm=5:
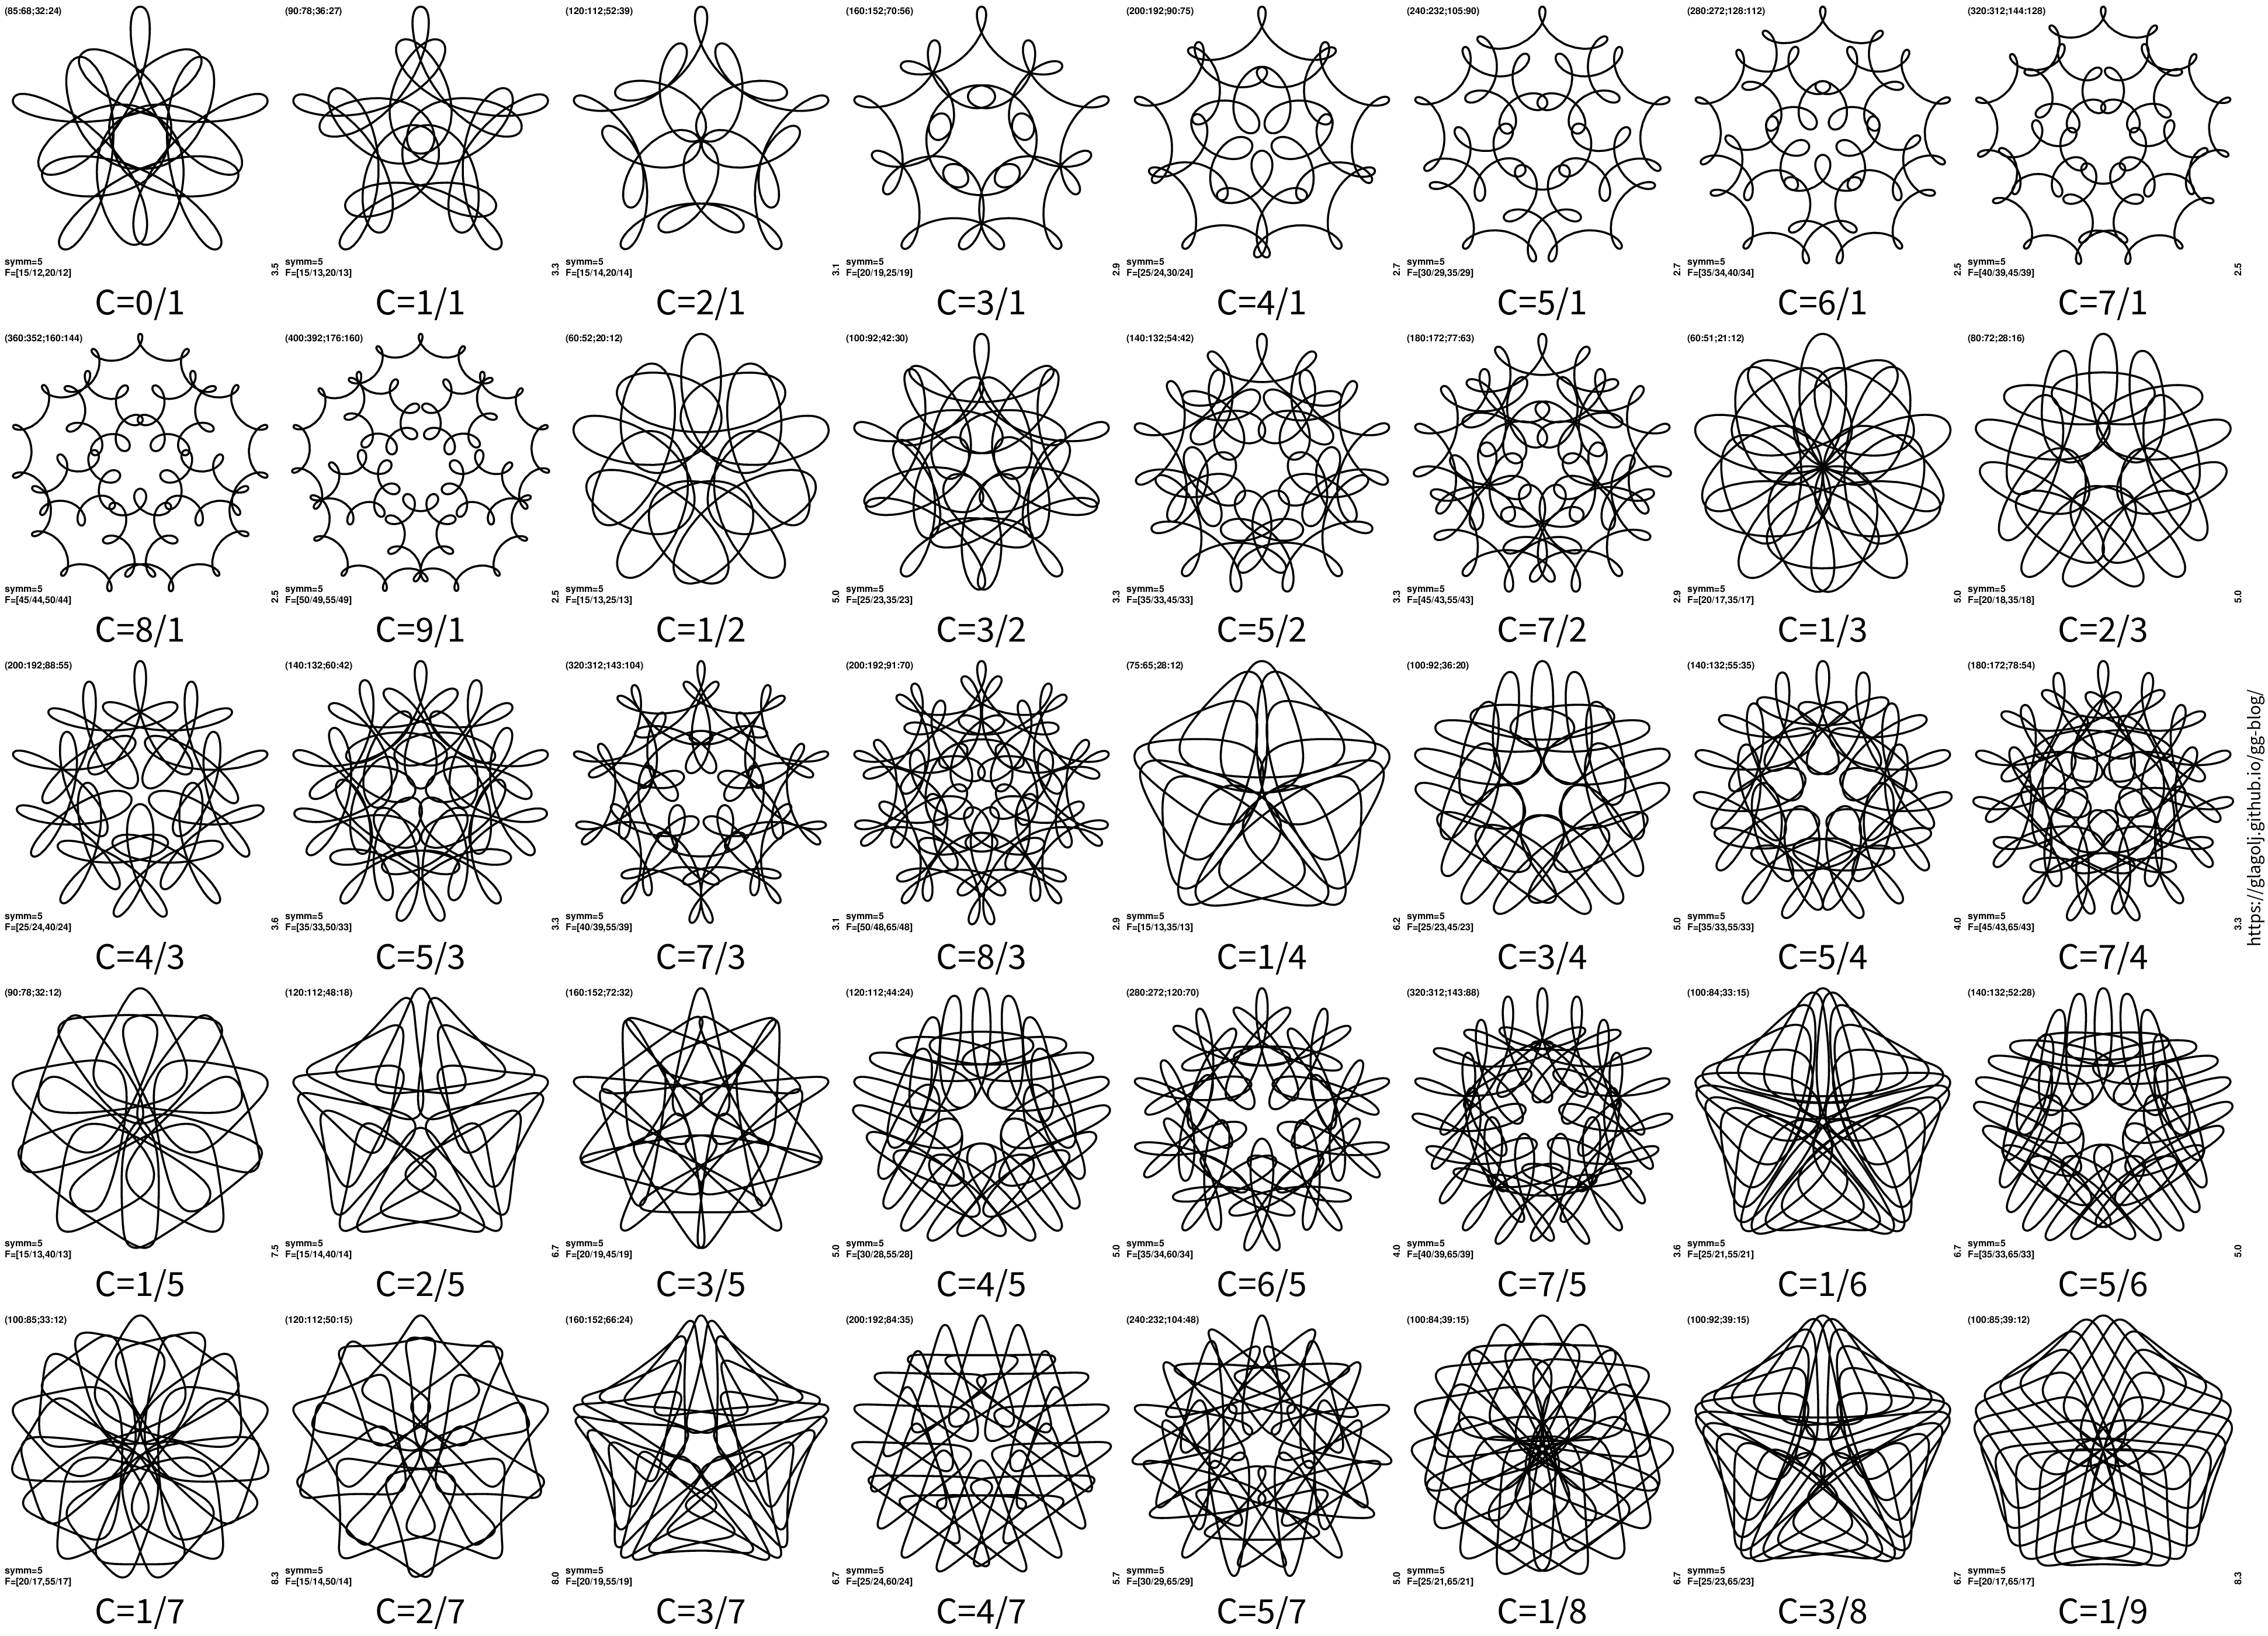
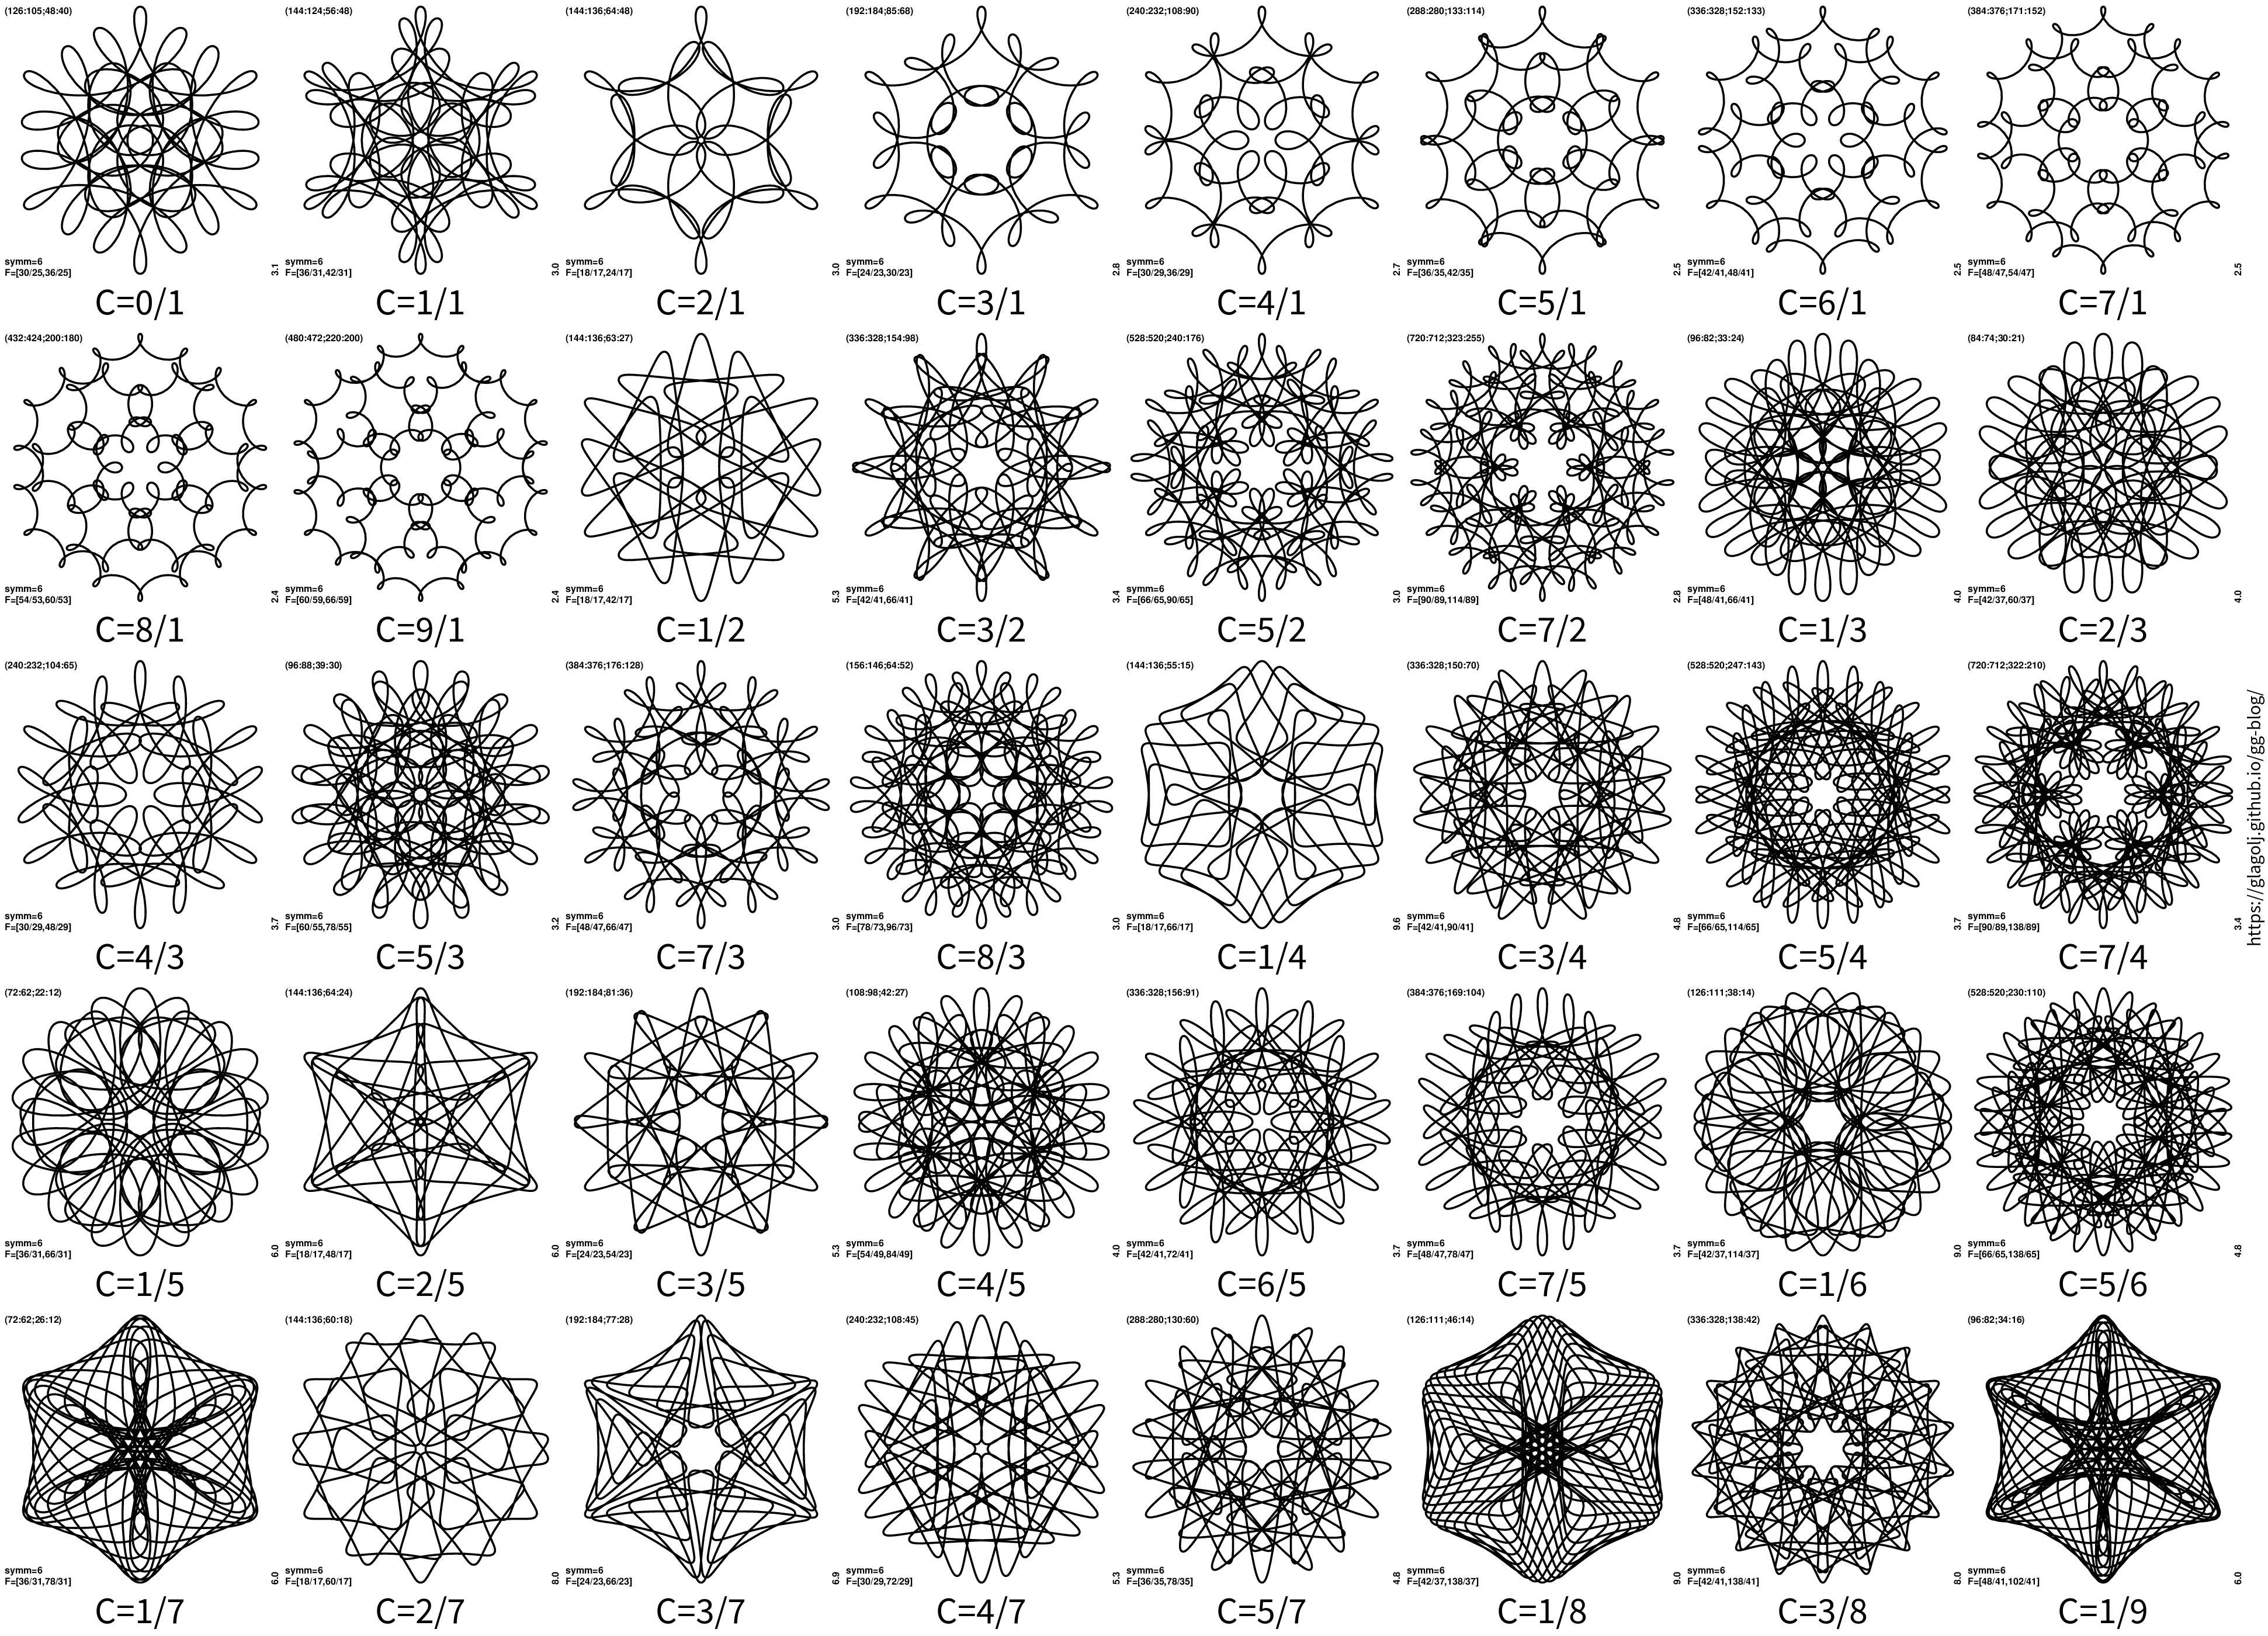
There is a lot of similarity to panels from 7-fold symmetry. And lets show nsymm=6:
What is also interesting is a plot of curves without rotational symmetry nsymm=1:
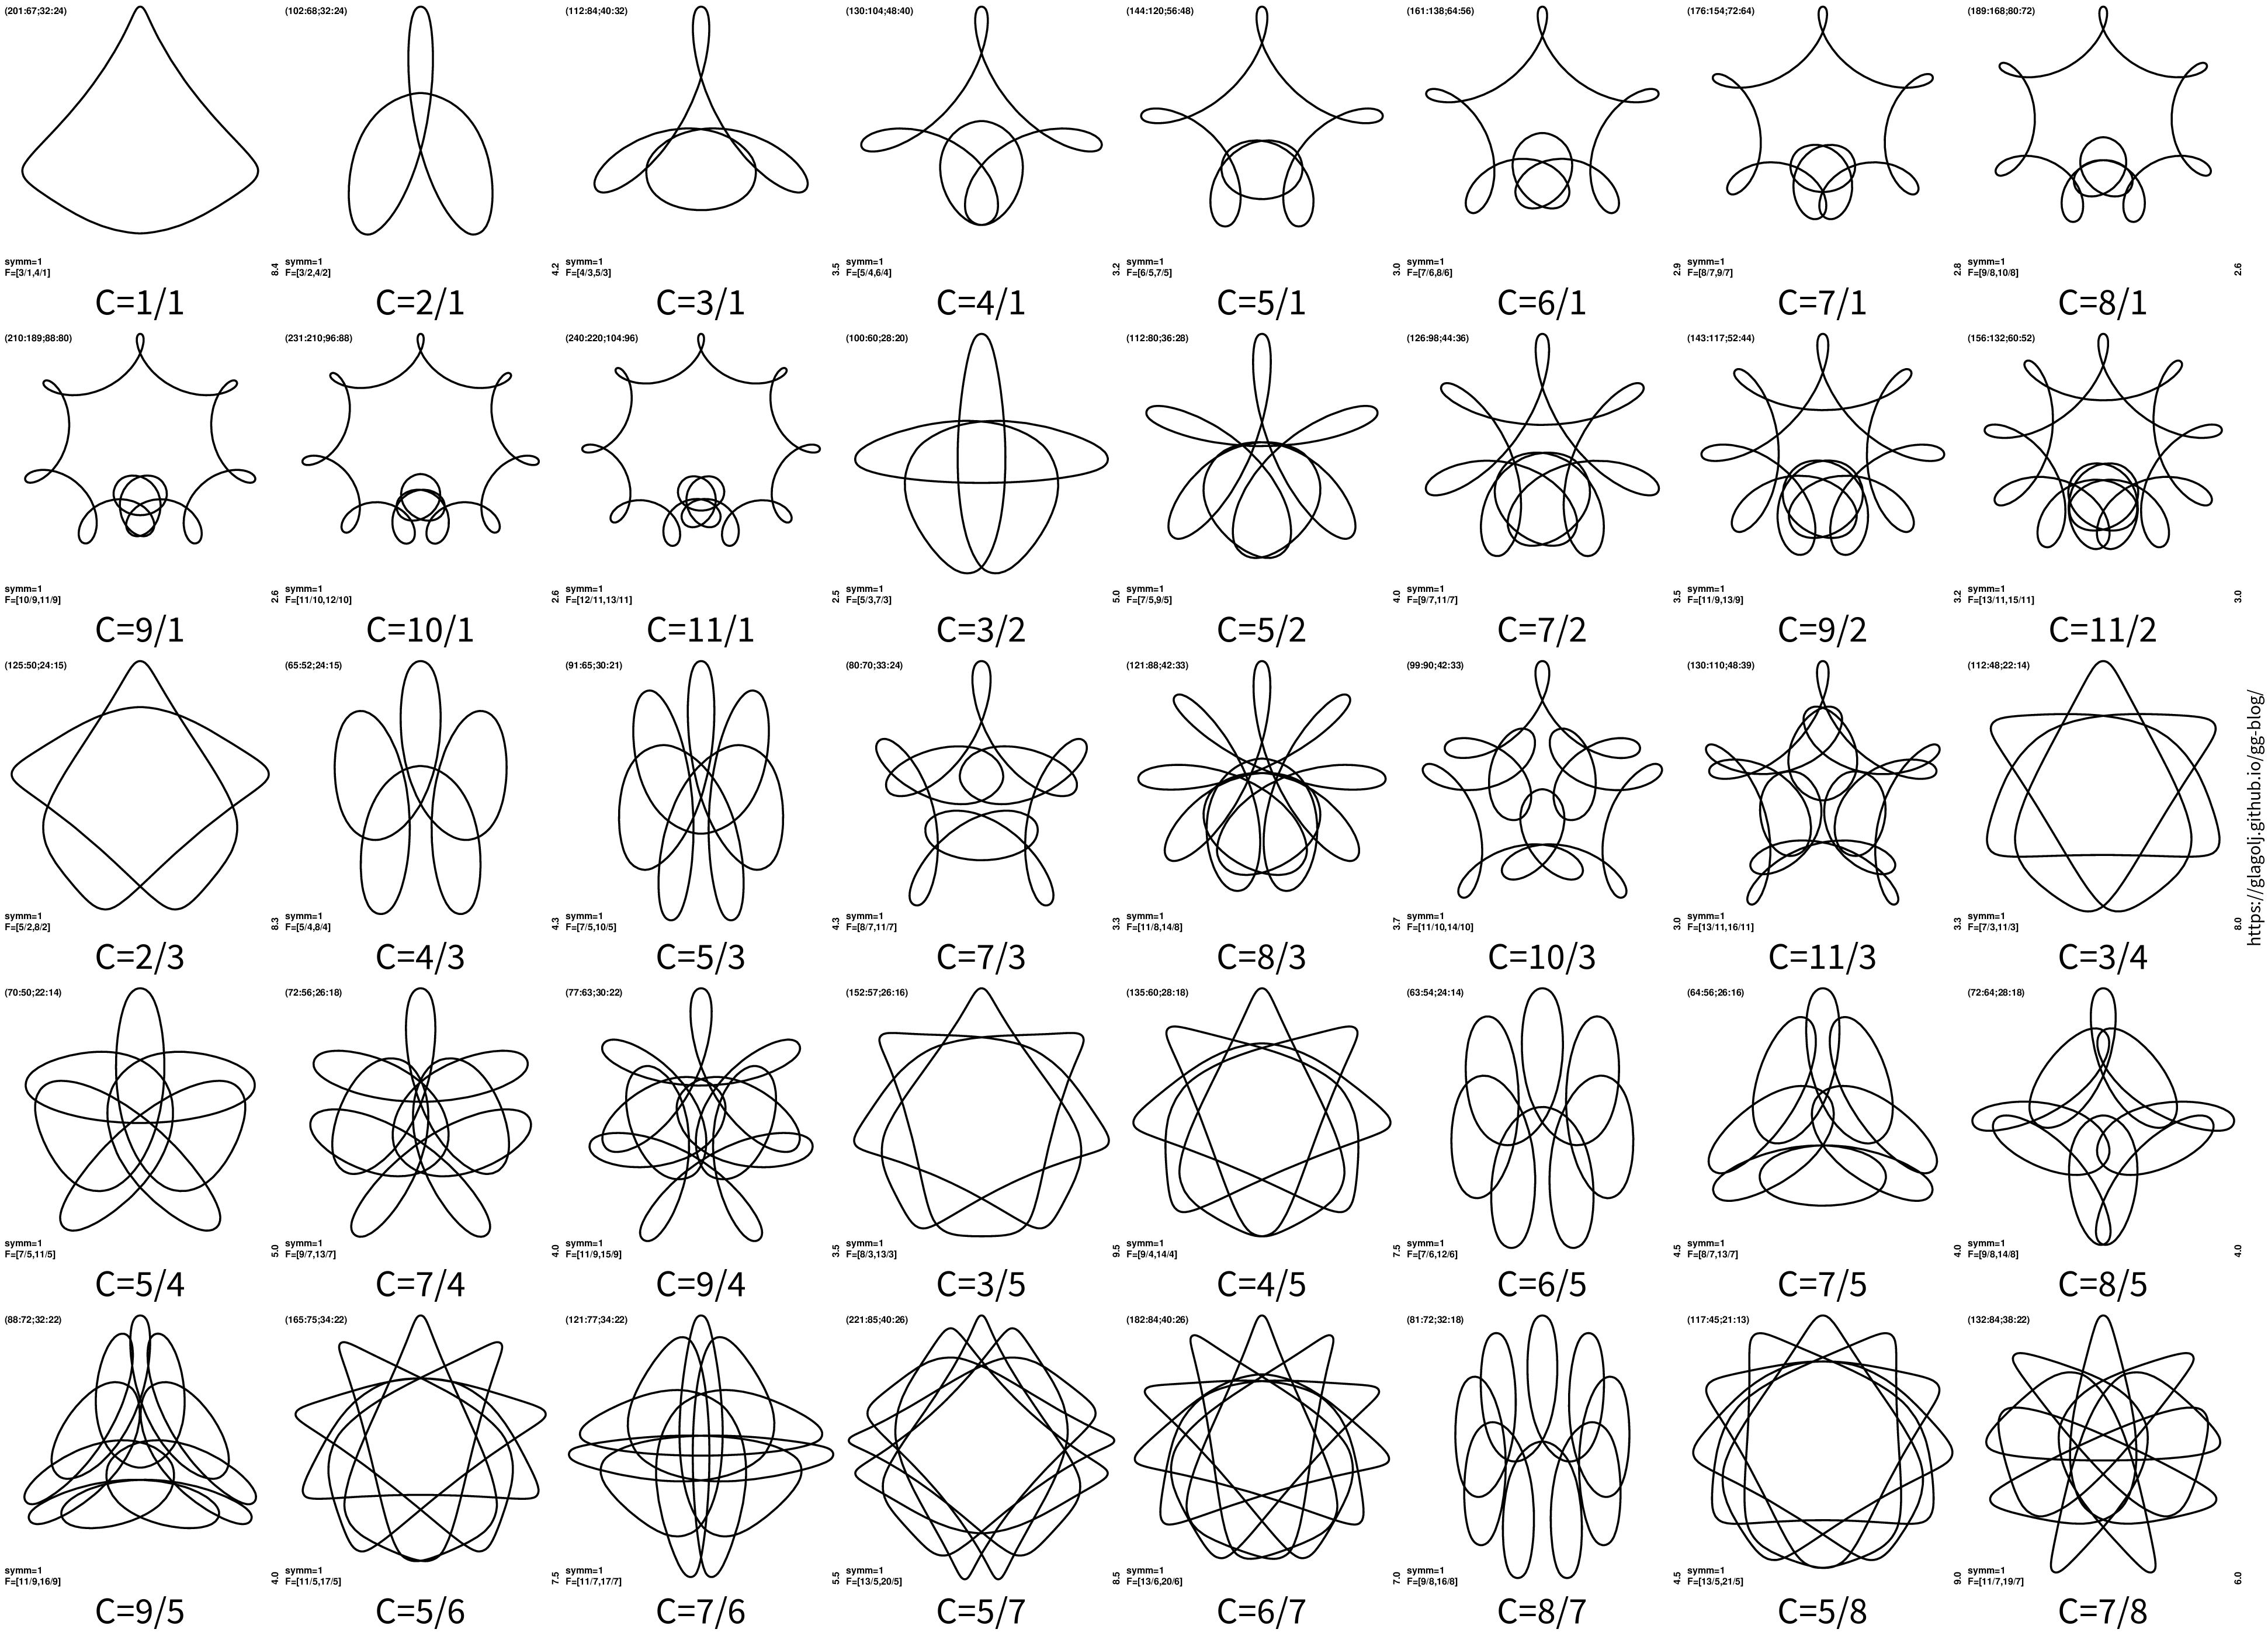
I used c>0.58, as small values are boring (see c=2/3 or c=3/4).
Comparing plots for different symmetries it looks that there is some property that is captured in the value of constant c=cp/cq. Looking at c=3/1 for different nsymm there is clearly the same “theme” on display. But also for more complicated fractions. It does seem that value cp/cq is capturing some property of these curves. However since I don’t know where does it come from, nor I have any theory behind it, this is more of an “experimental” approach 😀.