And another similarity
What I like the most about the gear-in-hoop-in-wheel spirograph curves is that the incredible variety of patterns is relatively easily reproducible on paper with just 3 simple geared elements. Well, maybe not all of it with the current set of wild gears, but still. But it just keeps surprising me with the intriguing patterns that are possible. Let me first show plot of another axis of similarity (click on the image for large version):
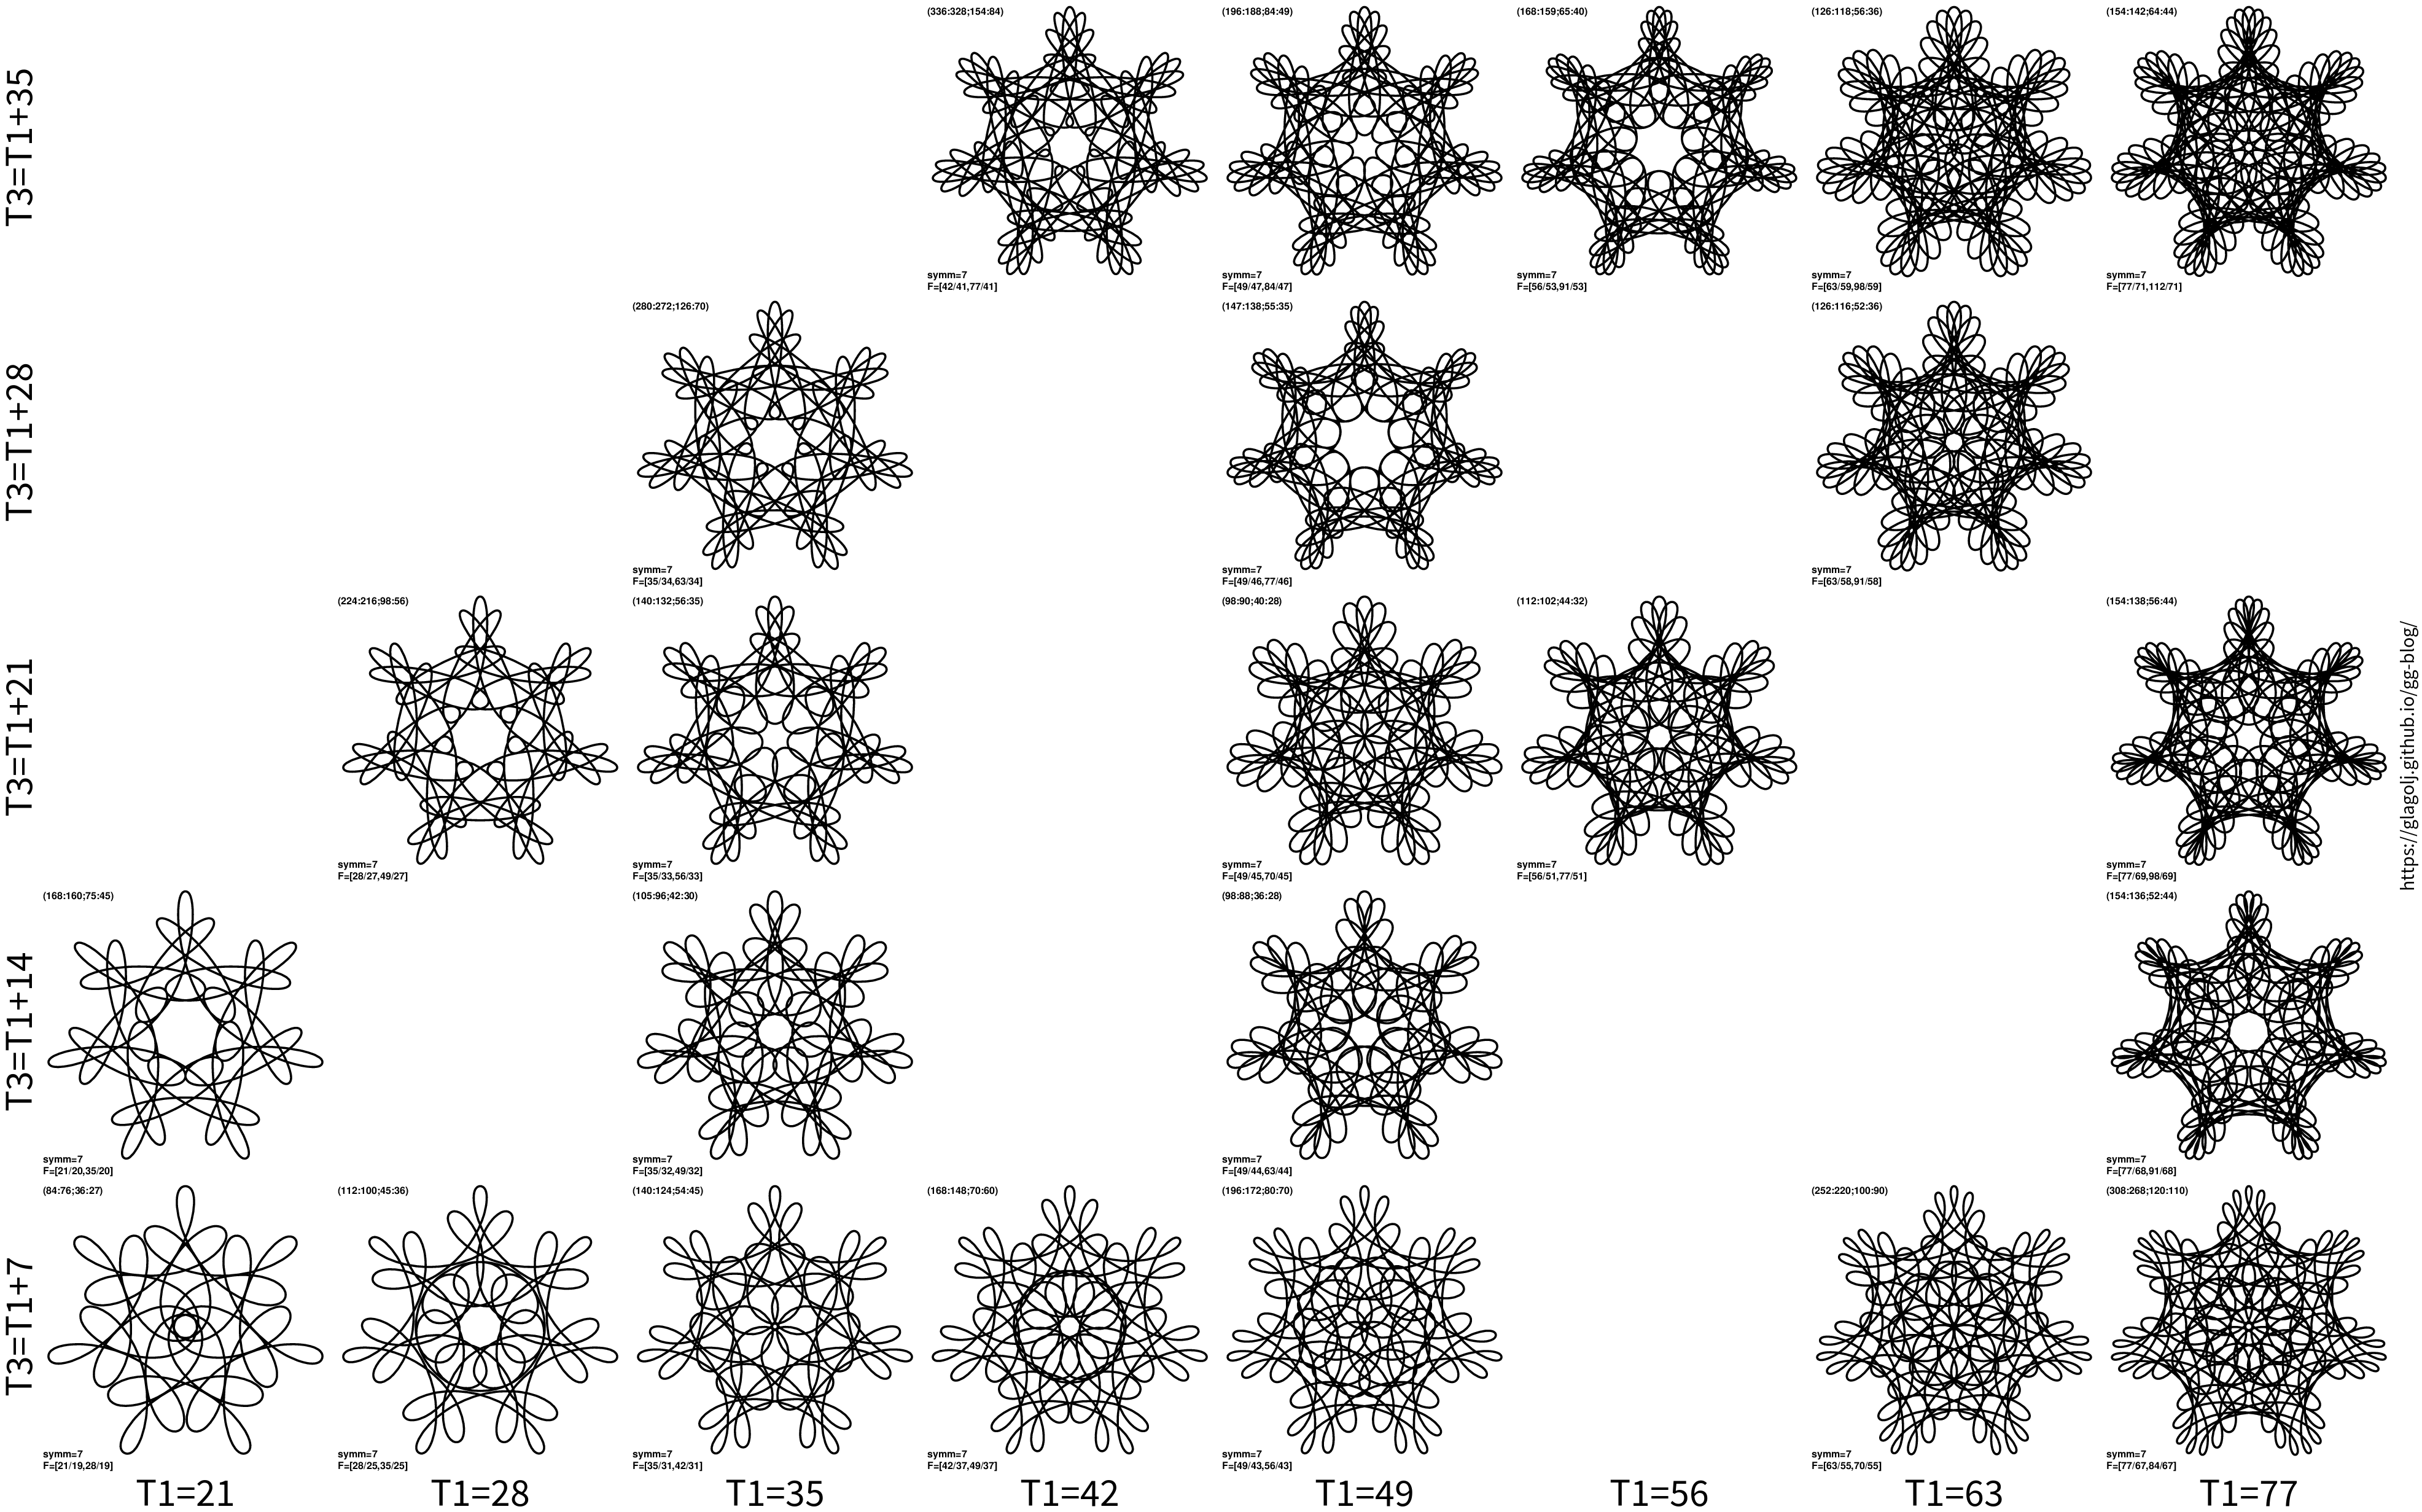
The patterns are very similar to each other, and continue to infinity both to the right, and beyond the top of the image. The succeeding patterns are very alike, with adding a lobe here and there, but in a very consistent way. The above plot looks like some 7-sided snowflakes, and each is reminiscent of the previous one.
In the previous article I described the first unexpected similarity of patterns. For each curve there are infinity many other curves that are similar looking. The above plot shows that similarity axis (left-right), but also another one as well (top-bottom). While I was further slicing and dicing the parameter space I noticed that there is another, independent, axis of similarity. However this took quite a while to find a working equation for parameters, as it was “experimental mathematics”. I don’t have formal proof for any of this, but I tested extensively for many many curves and parameters.
Equation describing similarity of curves is as follows. For a given curve F=(T1/T,T3/T) and rotational symmetry nsymm=gcd(T1,T3), there are similar curves F’=(T1‘/T’,T3‘/T’) with:
T1’ = T1 + k ⋅ nsymm,
T3’ = T3 + k ⋅ nsymm + l ⋅ nsymm,
T’ = T + k ⋅ (nsymm - 1) + c ⋅ l,
c = ( T1 - nsymm⋅(T1 - T) ) / (T3 - T1),
where k and l are arbitrary integers, and c is a constant that can be a rational number (though often it is integer). The part with k was topic of the previous article, while we now added l terms. The hardest part for me was figuring out c⋅l term. I don’t know where does that come from.
The above plot example is completely described with nsymm=7 and c=1: then X axis is k increasing while l constant, and Y axis is k constant and l increasing. Such images typically have missing panels. That is partially as we need physically possible gear system T’<T1‘<T3’ (missing top-left). Then some (k,l) values will give a higher symmetry (multiple of nsymm) or T’ should not contain a factor that divides both T1’ and T3’. And if c is fraction then c⋅l has to be an integer. This (k,l) swiss cheese with holes reminds of sieve of Eratosthenes. But when one looks back at (T1‘,T3‘,T’) the values form a lattice (with some missing vertices).
Simpler curves are typically obtained with small integer c≥0, such as c=0, or 1, or 2… Somewhat more complex curves are obtained for small fractions, such as, c=1/2, or 1/3 or 2/3. As far as I can tell c<0 is also a valid choice, but to me it looks that visual similarity is then restricted to T3 ≤ 2T1, however this needs more work.
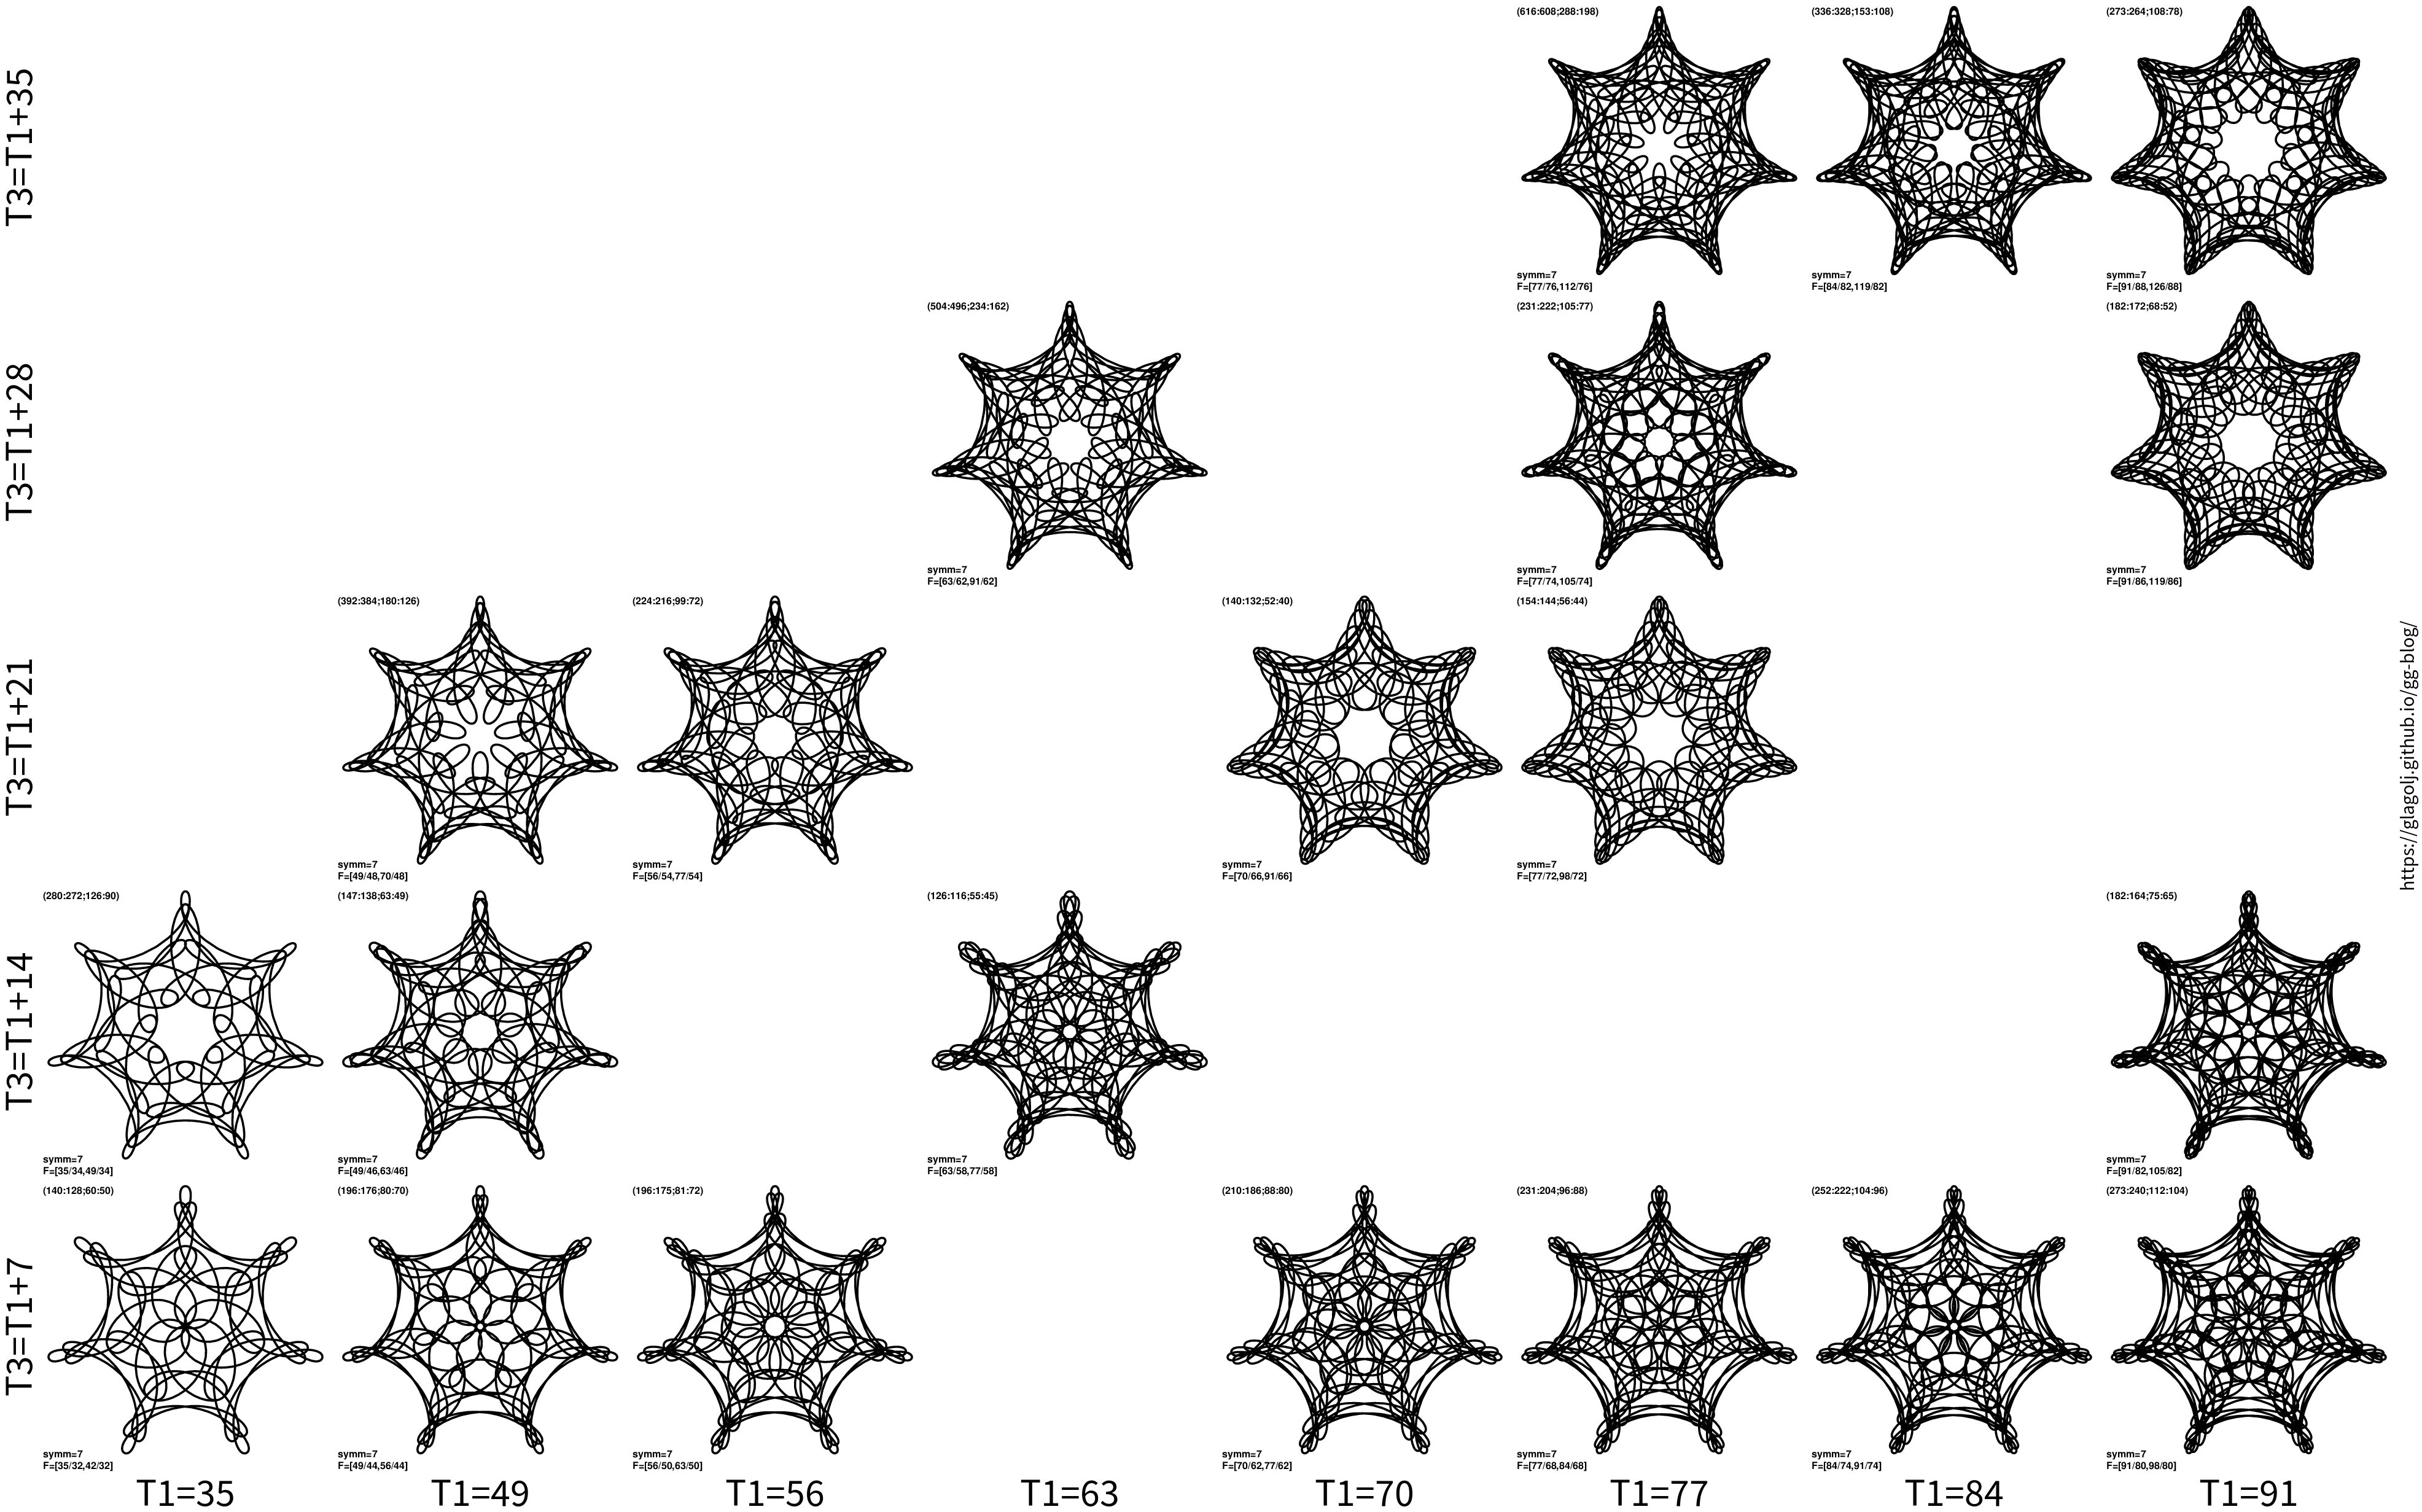
Here is another plot with nsymm=7 and c=2:
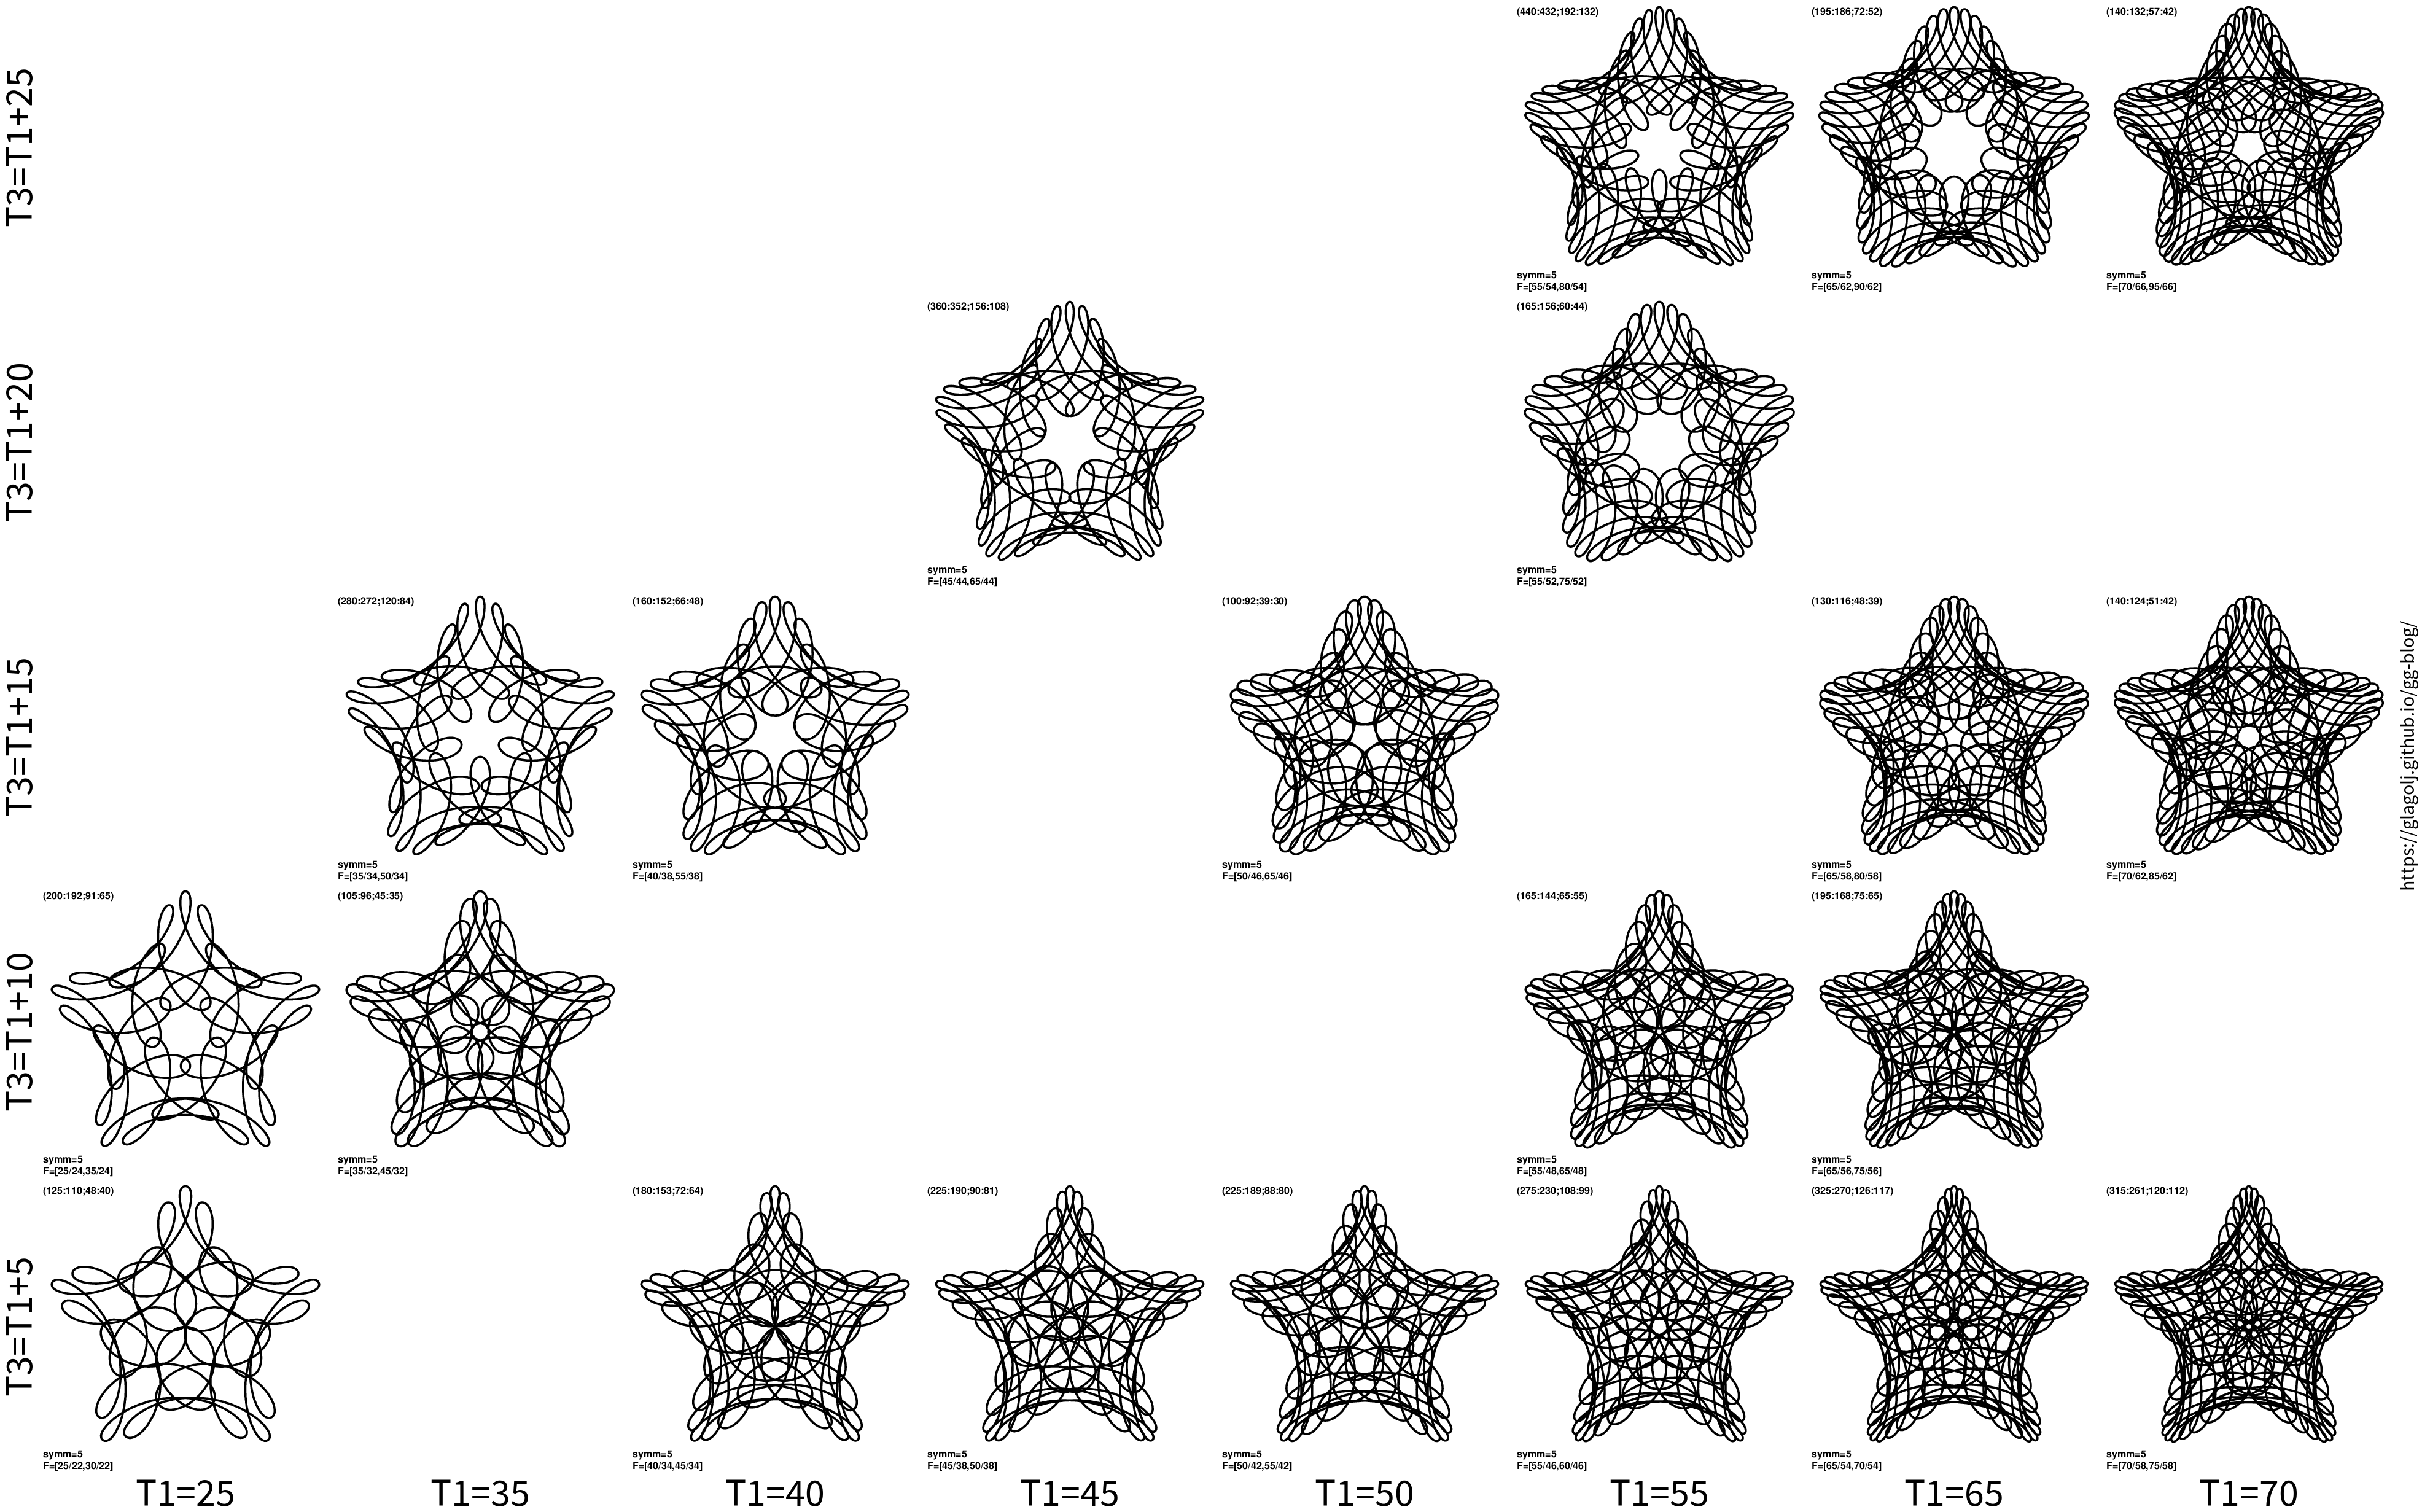
Or nsymm=5 and c=2:
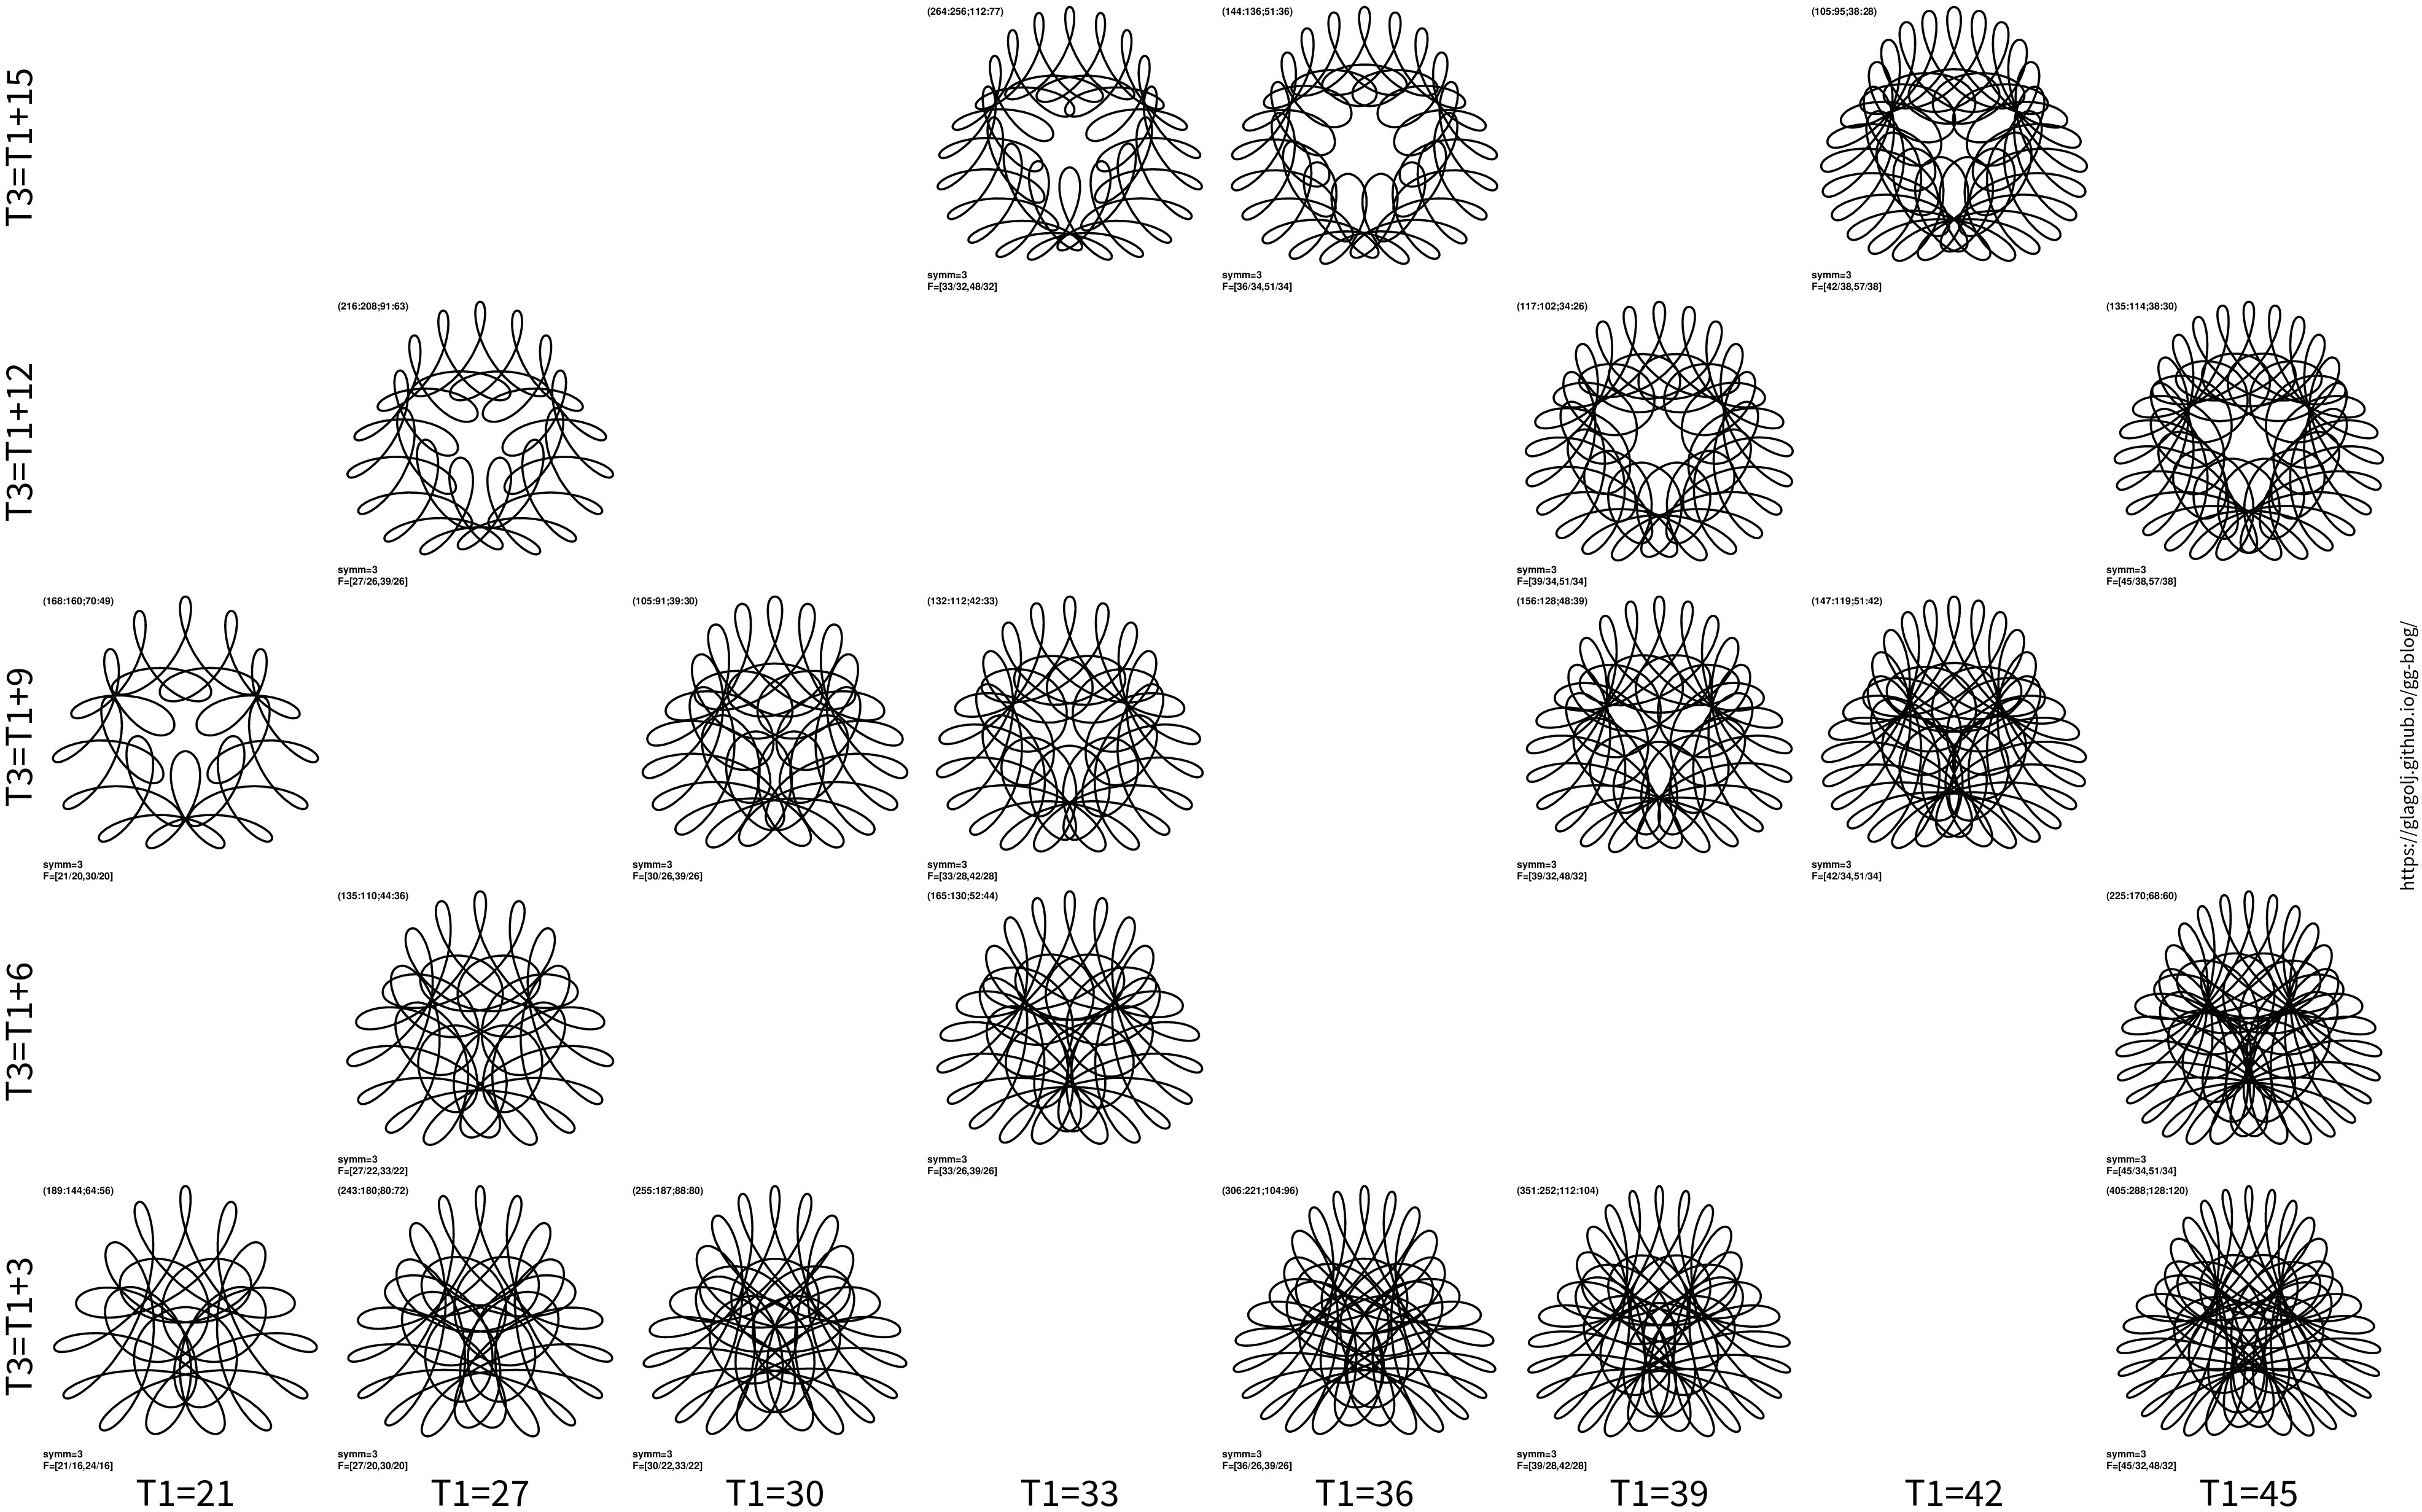
nsymm=3 and c=2:
Final remark: hoop offsets I used are about h=0.45, while wild gears have h parameter in larger range which would somewhat diminish visual similarity.