Similarity across rotational symmetries
This post is thematically another paragraph of the previous article on similarities between 2nd order roulette curves. I will show how “similarity” sets look across different rotational symmetries nsymm. For me this is the strongest argument that coefficient c=cp/cq is capturing some intrinsic property of gear-in-hoop-in-wheel patterns.
The plot easiest to grasp is for c=2, 3, 4, 5, 6 on Y axis for different rotational symmetries nsymm on X axis (click for large image):
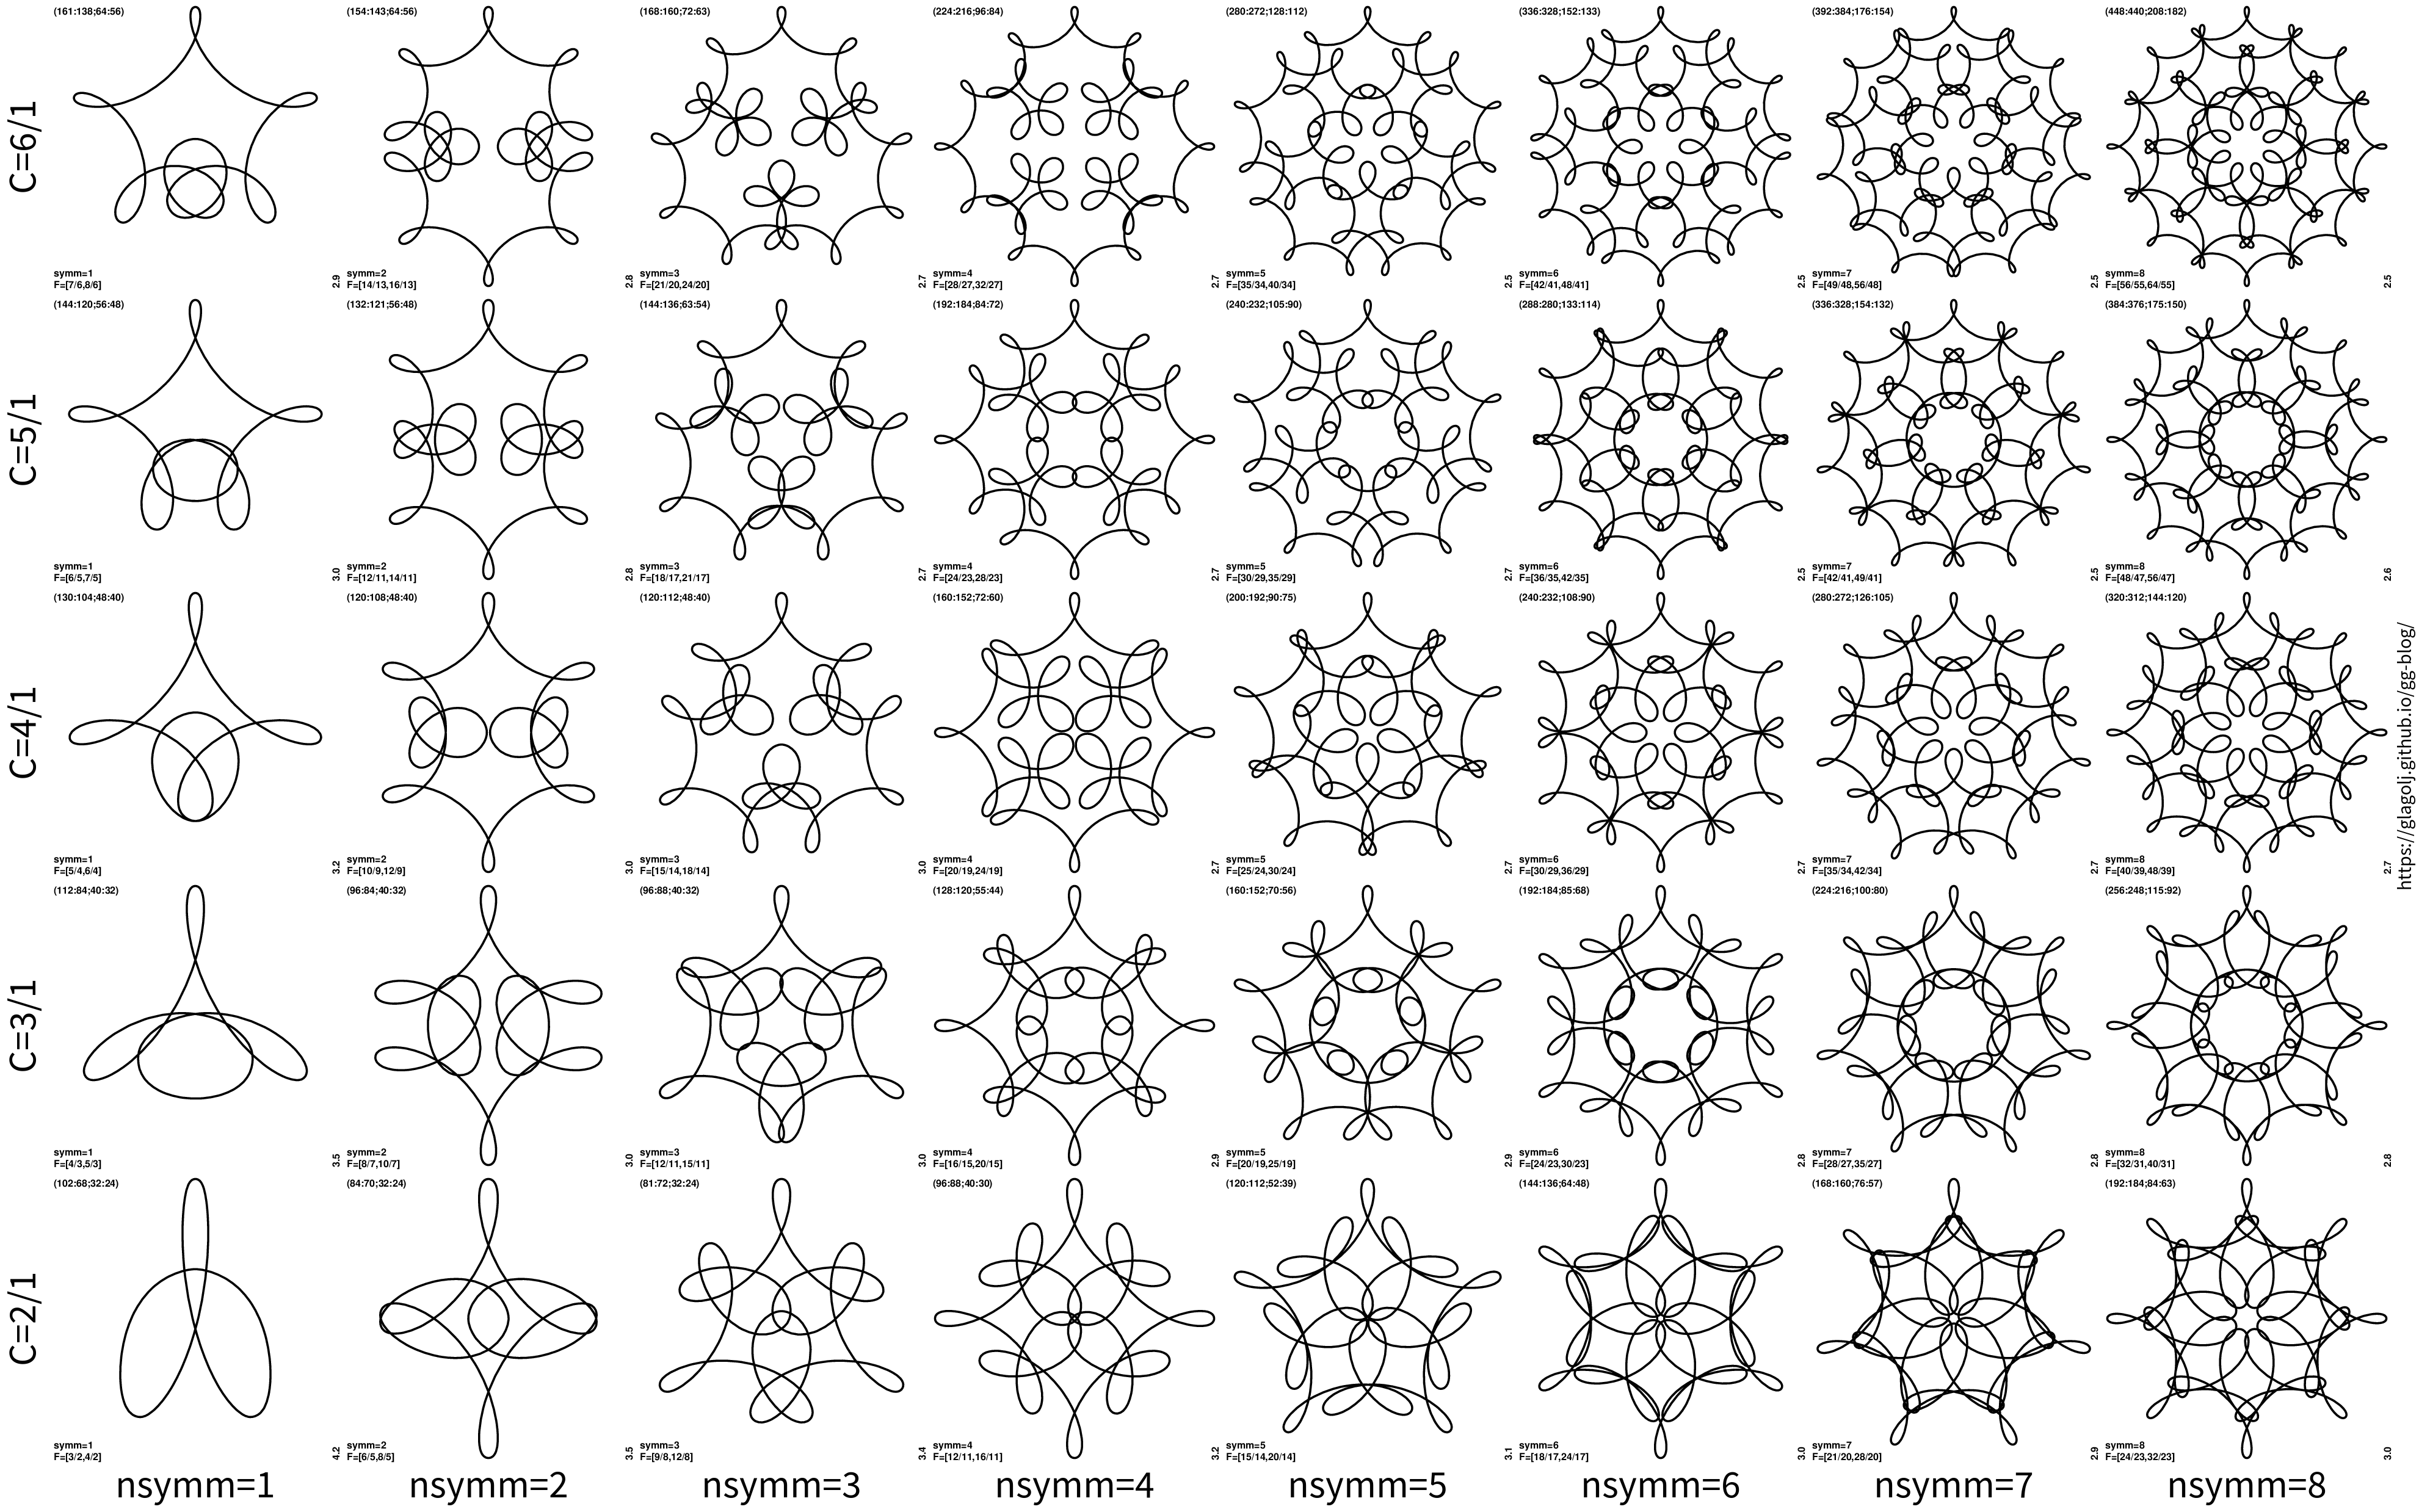
If one looks at each row, for same c value, there is “similar theme” on display, just folded either twice over, or 3 times over, etc. Take for instance c=5/1 for nsymm=1. Imagine that we cut curve from its center to bottom, and then shrink it and replicate it once more: we roughly get the panel for nsymm=2. Shrink more, such as 1/3, and duplicate it 3 times, we get the figure for nsymm=3. Here is bit more complicated plot for c=2/3, 4/3, 5/3, 7/3 and 8/3:
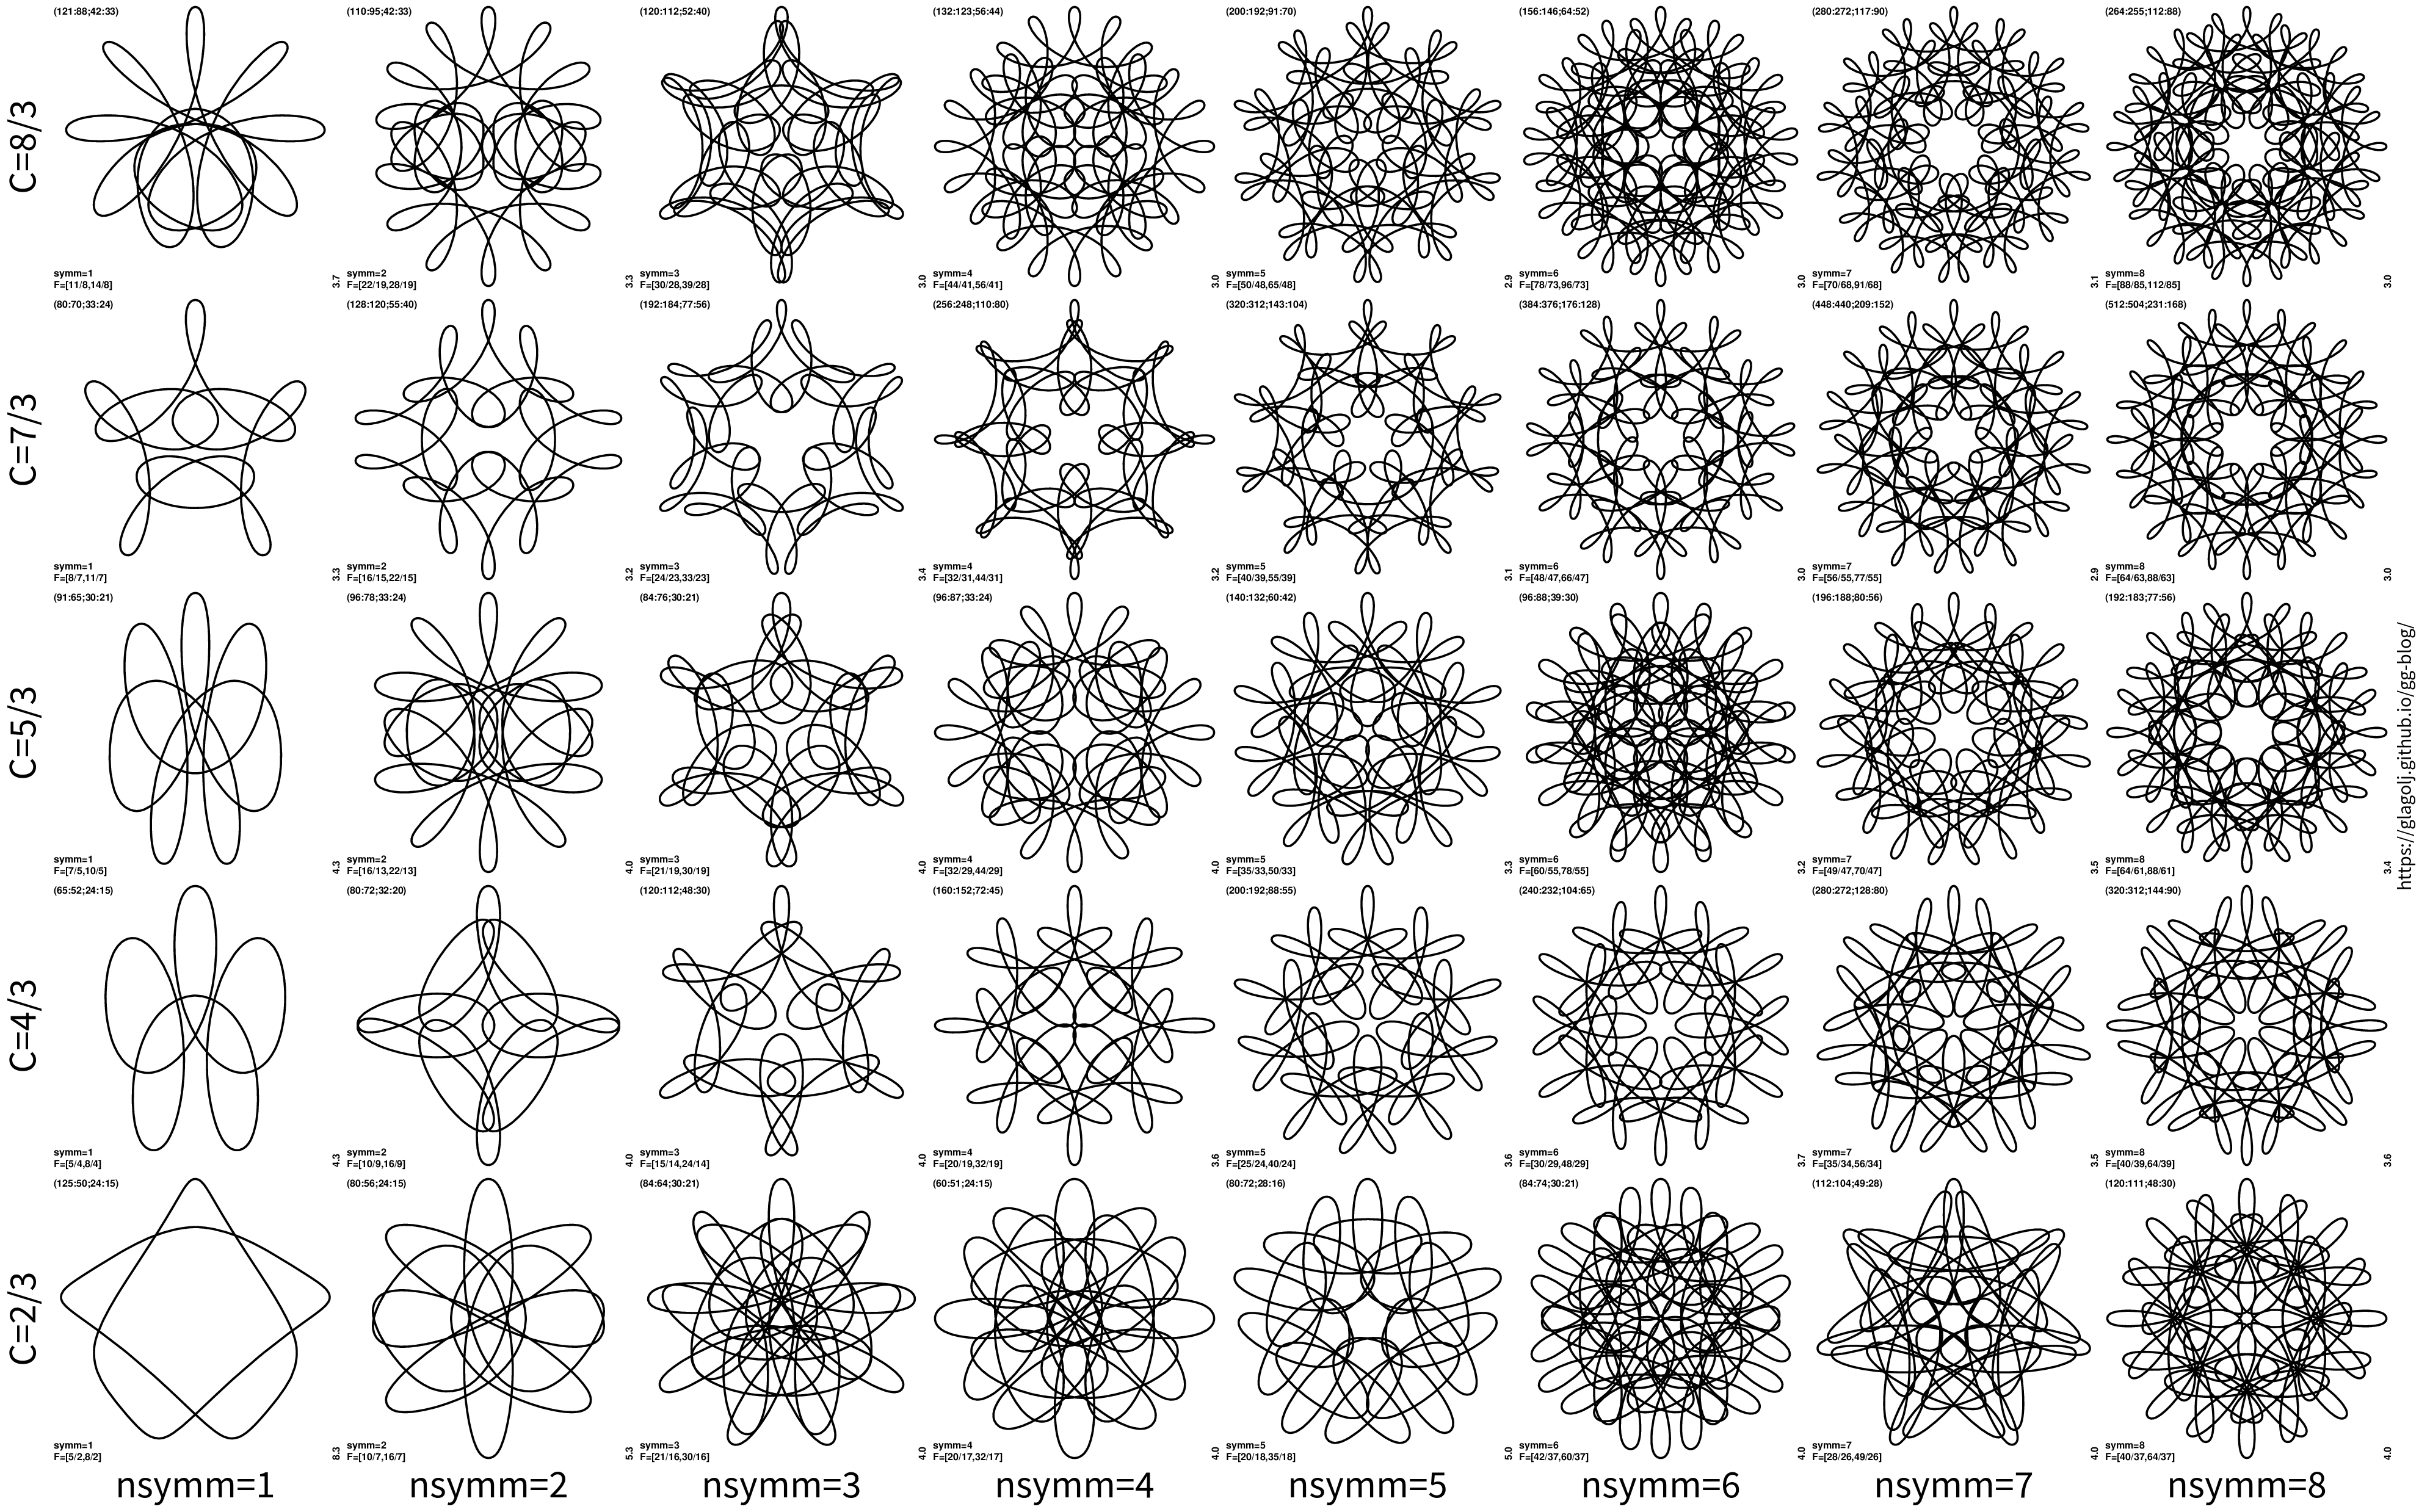
The similarity is not always perfect. But in many cases there is “similar theme” on display across different rotational symmetries. It can be hard to spot it though.
Some examples show more similarity among odd or among even nsymm. Here is a plot for c=7/2, 7/3, 7/4, 7/5, 7/6:
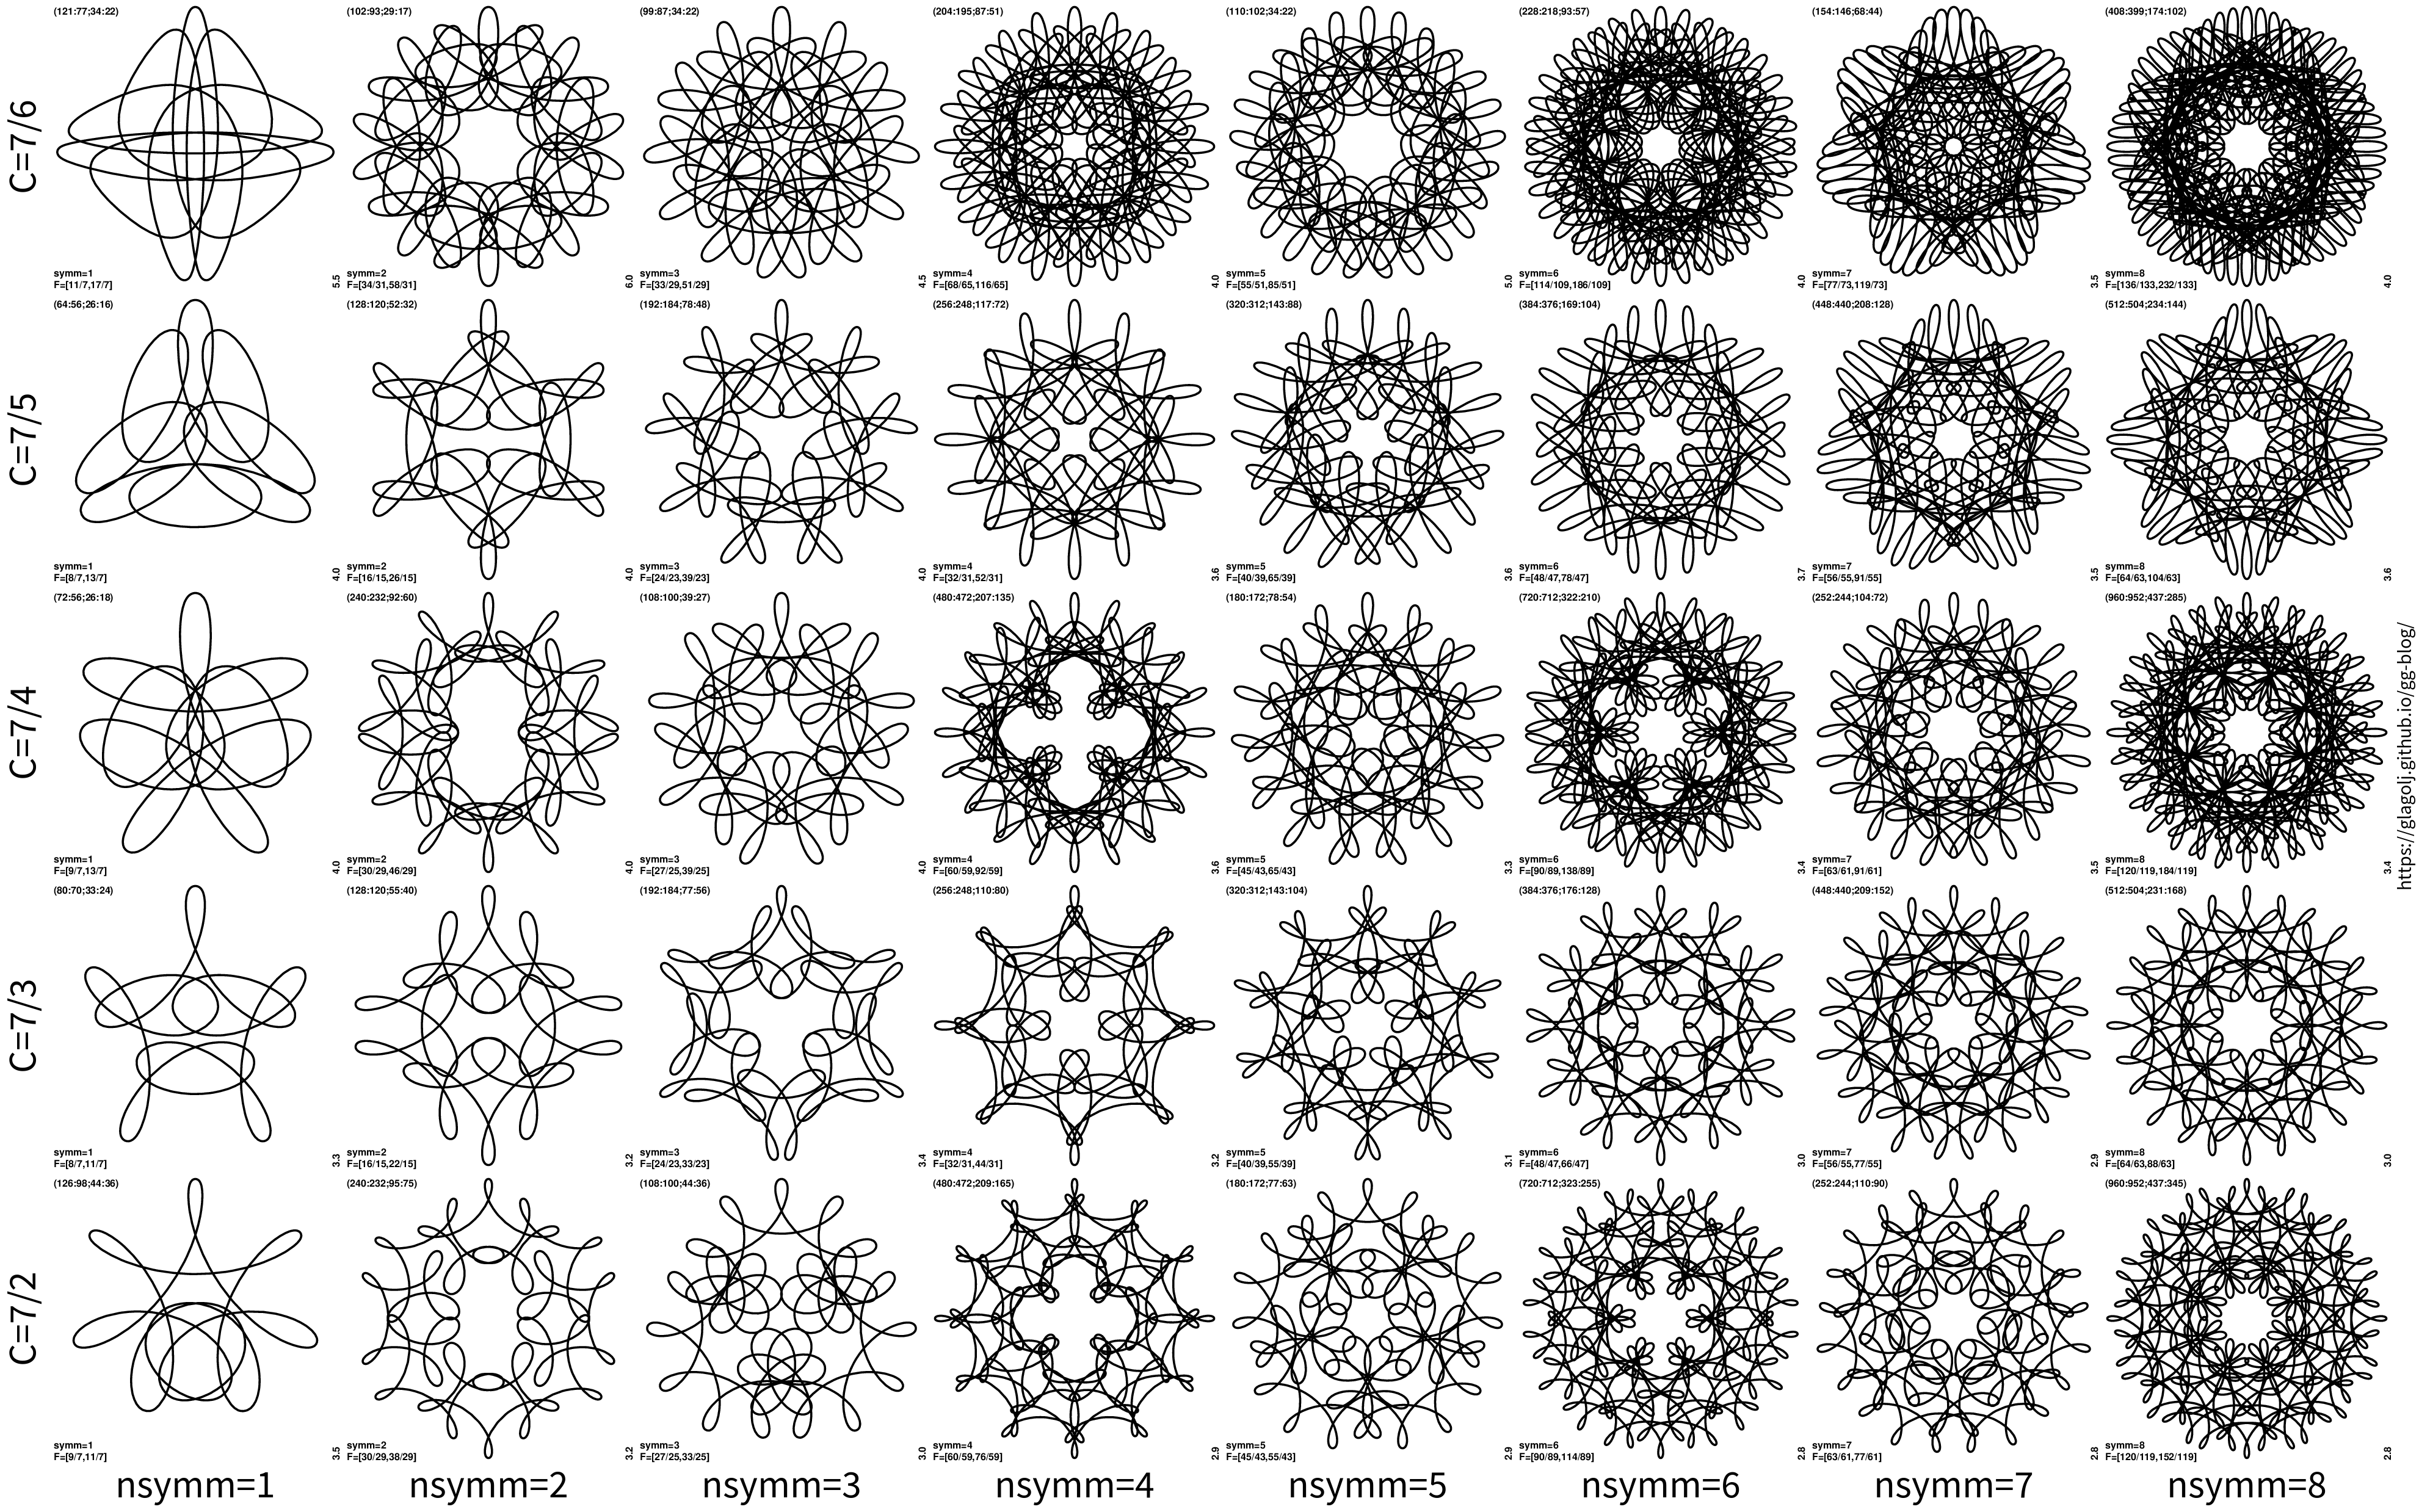
And plot for for c=5/2, 5/3, 5/4, 5/6, 5/7:
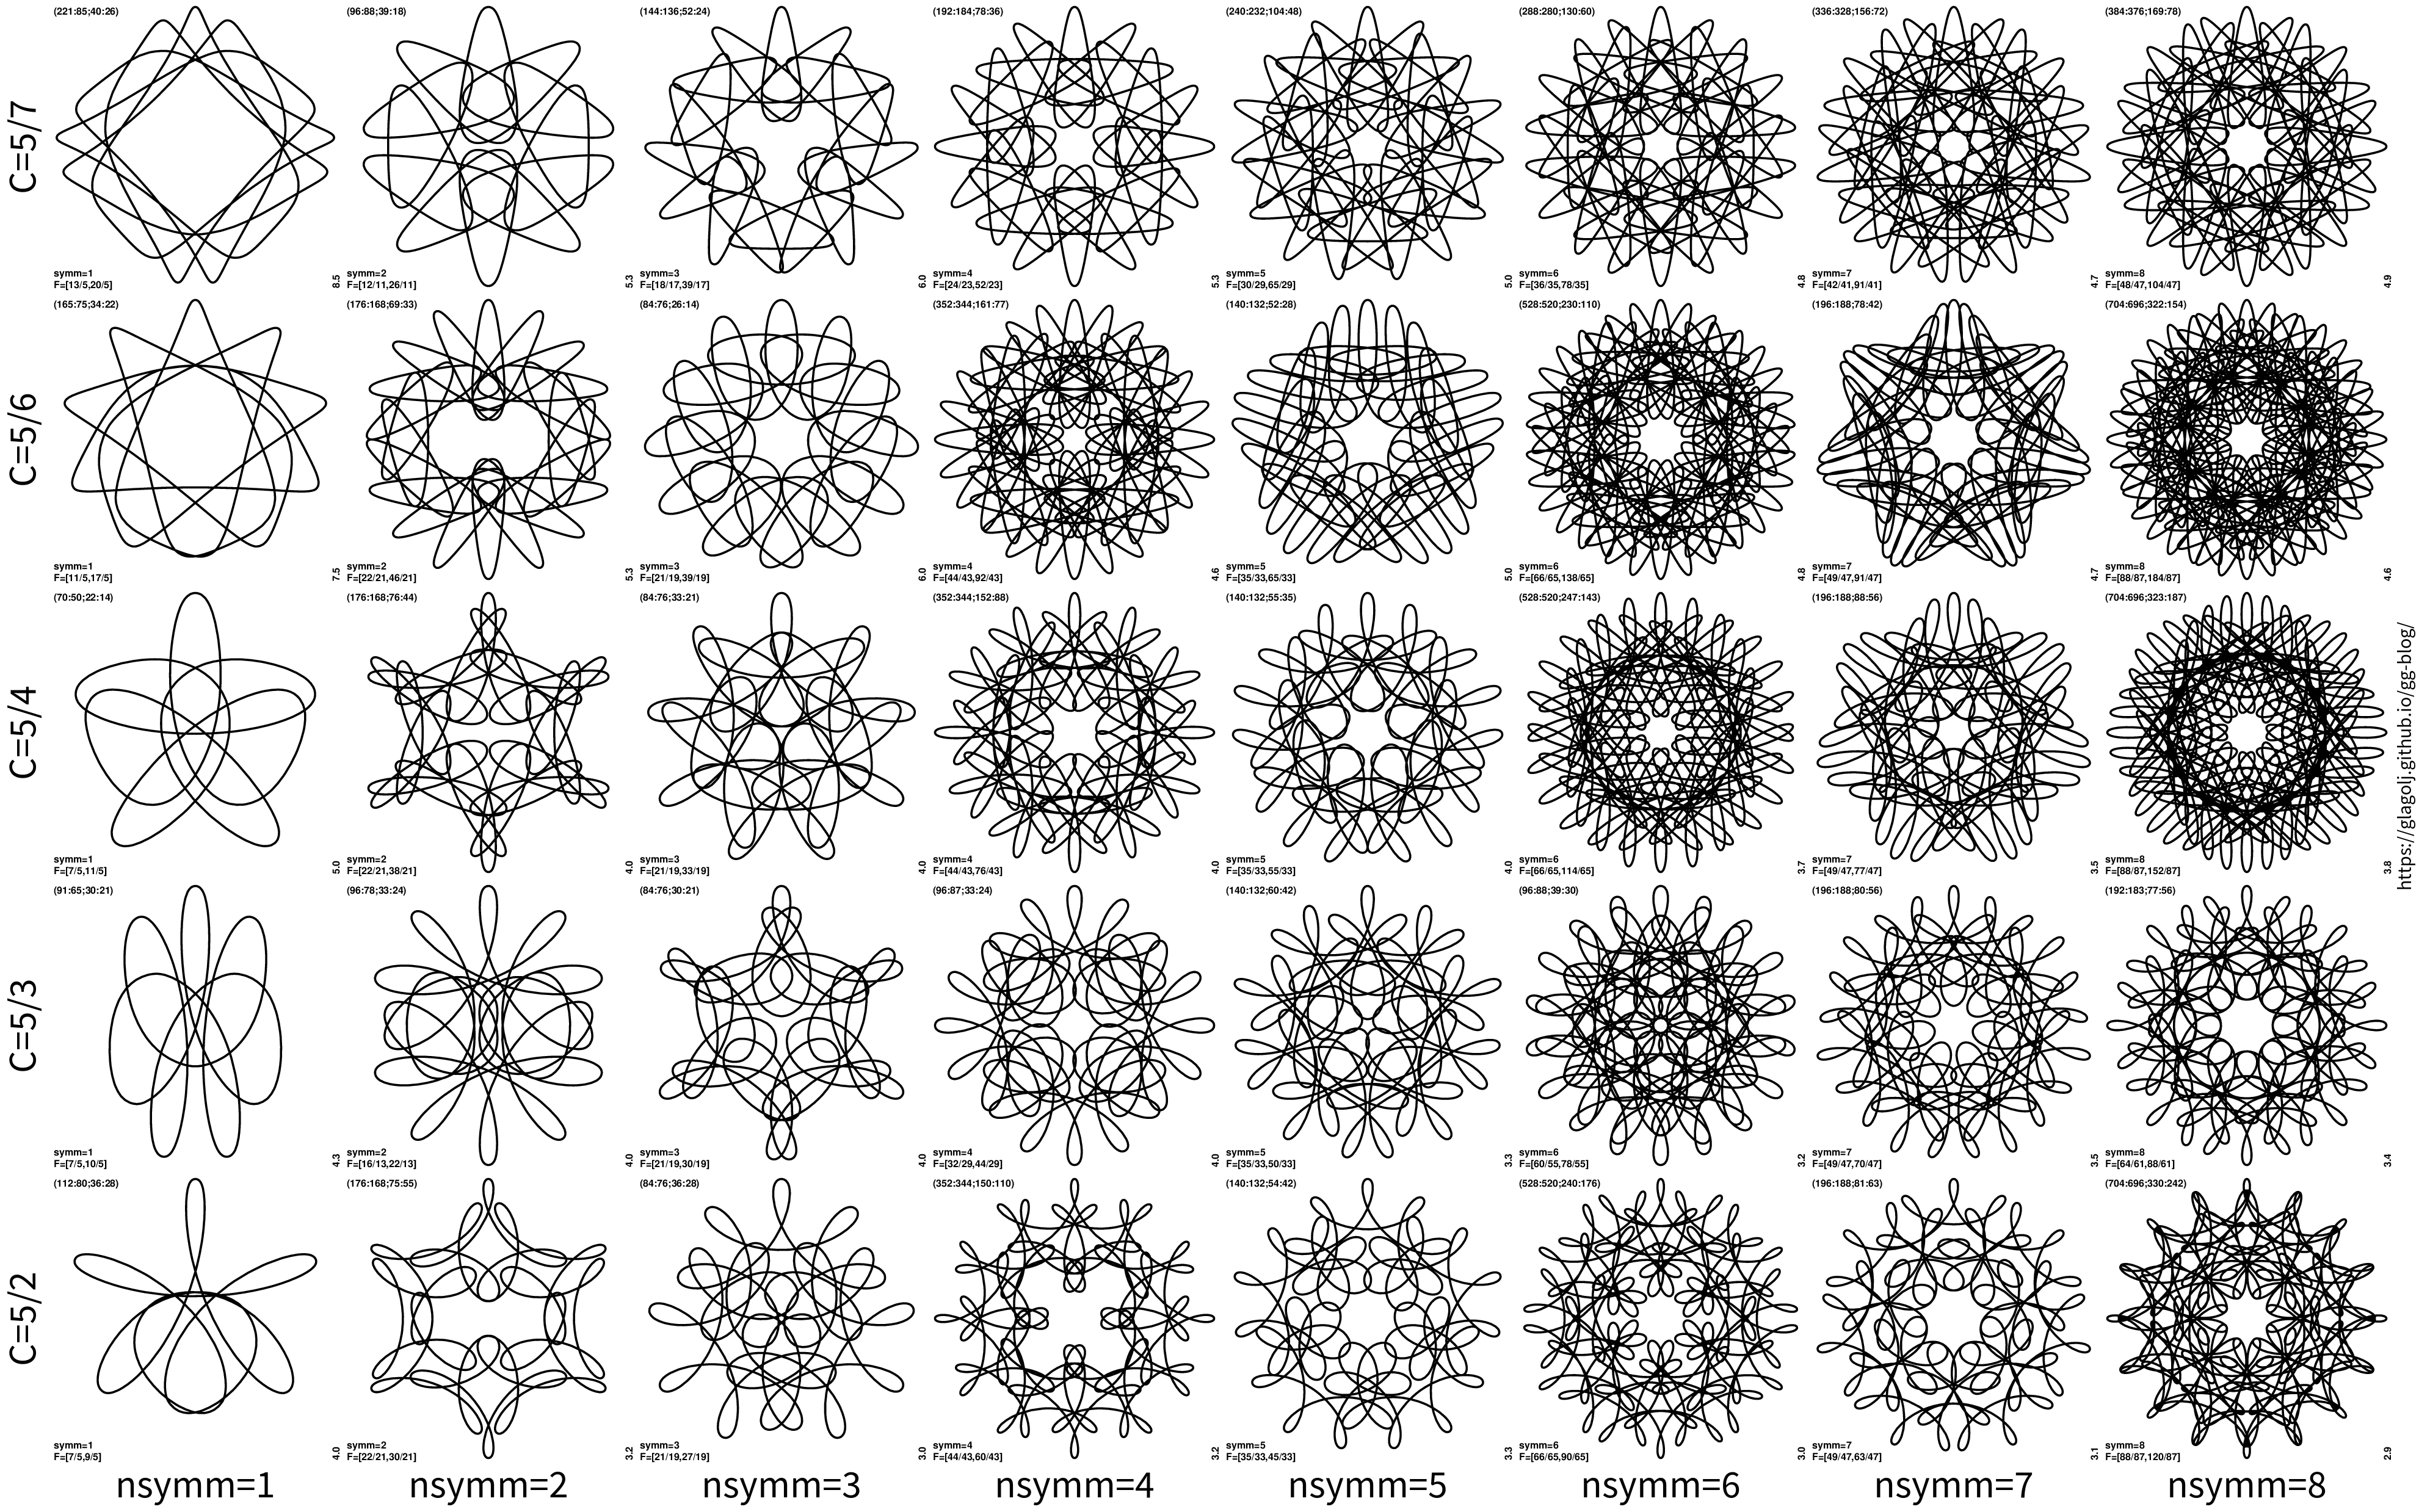
There is probably one more interesting takeaway point. Take for instance the last panel of the above plot: c=5/2 and nsymm=8. In that case the frequencies are F=(88/87,120/87). Those are very big numbers and it would not be easy to draw it (we roll 88 times the hoop!). However the figure itself is not messed up too much: In most cases such big numbers mostly produce a black indiscriminate blob. So the answer why some patterns are not messed up, even if those are hard to draw and consist of many many lines, is probably because the curves have a simple value of c (in out example c=5/2).